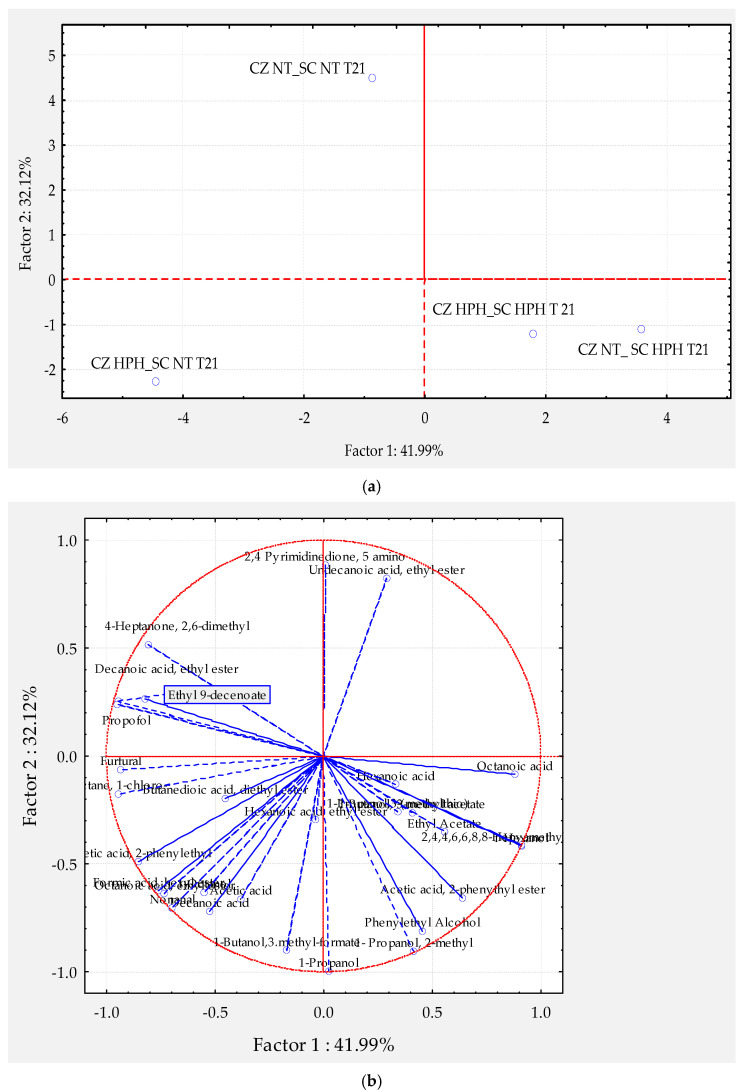
Figure 5.
(a) Principal component analysis loading plot (PCA) of the PC1 and PC2 of wine samples volatile aroma profiles obtained by scalar fermentation of a wild strain of Candida zemplinina (CZ) and a commercial strain of S. cerevisiae (SC) after 21 days of fermentation and in relation to the initial HPH treatment; (b) Principal component analysis factor coordinates (volatile compounds) mapped in the space described from PC1 and PC2, accounting respectively, the 41.99% and 32.12%, variance among samples observed.

