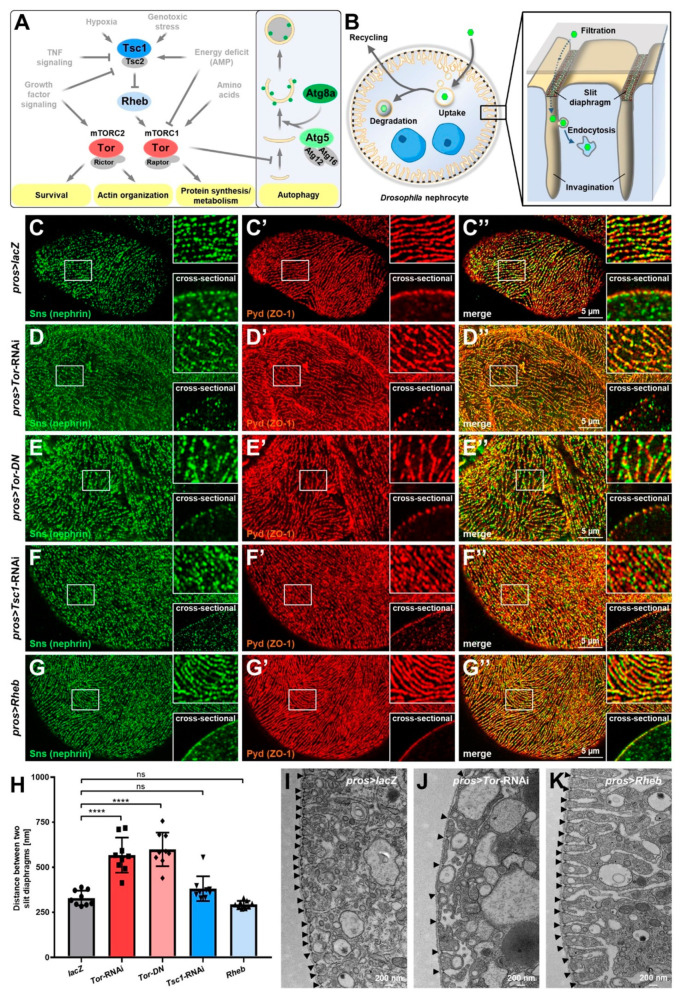
Figure 1.
Inhibition of mTOR signaling increases spacing of slit diaphragms in Drosophila nephrocytes. (A) Simplified representation of the mTOR and autophagy pathway. The signaling pathway components targeted in this study are highlighted by colored circles. (B) Schematic illustration of the ultrastructure and basic function of podocyte-like Drosophila nephrocytes. The bi-nucleated nephrocytes remove undesired particles (green hexagons) from the larval plasma (hemolymph) by endocytic uptake for subsequent storage, degradation, or recycling. Endocytosis occurs in membrane invaginations covered by a bi-layered filtration barrier consisting of the basement membrane (gray surface) and the slit diaphragm formed by the proteins Sns and Kirre (depicted in green and red). (C–G’’) Confocal microscopy of nephrocytes co-stained for Sns (nephrin) and Pyd (ZO-1). Magnified regions of the tangential sections are shown in the upper insets, and surface details from cross-sections in the lower insets. lacZ expressing control cells display the regular fingerprint pattern of slit diaphragms (C–C’’) while cells expressing either Tor-RNAi (D–D’’) or a dominant-negative variant of Tor (Tor-DN, E–E’’) under control of pros-GAL4 show wider spacing. In contrast, induction of mTOR signaling by expression of Tsc1-RNAi (F–F’’) or overexpression of Rheb (G–G’’) results in a regular slit diaphragm pattern comparable to control cells. (H) Quantification of the distance between two slit diaphragms is shown analogous to conditions in (C–G’’). Distances were measured along a linear path representing the widest diameter of individual cells. Data shows mean ± standard deviation, n = 9 animals per genotype with three cells for each animal (every dot, square or triangle represents one animal of the indicated genotype). Statistical differences were assessed by one-way ANOVA with post-hoc analysis, p < 0.0001 (****) for Tor-RNAi, p < 0.0001 (****) for Tor-DN, p > 0.05 (ns) for Tsc1-RNAi, p > 0.05 (ns) for Rheb. (I–K) Transmission electron microscopy (TEM) images of cells expressing lacZ (I), Tor-RNAi (J), or overexpressing Rheb (K). Increased and irregular distances of slit diaphragms are exclusively observed upon expression of Tor-RNAi (slit diaphragms highlighted by arrowheads). Inhibition of mTOR further reduced the depth of the labyrinthine channels representing membrane invaginations. In contrast, labyrinthine channels are deeper when mTOR signaling is induced by overexpression of Rheb while slit diaphragm distances are regular.

