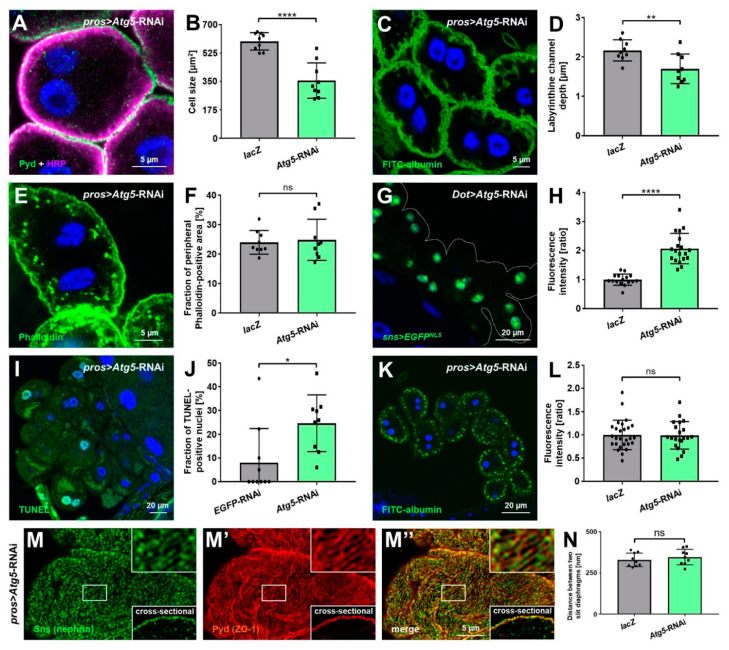
Figure 5.
Basal autophagy in nephrocytes limits expression of sns (nephrin) and promotes survival but is dispensable for slit diaphragm formation and endocytic function. (A) Nephrocytes were stained for Pyd to assess cell size. Co-staining with HRP confirms the correct localization of Pyd at the cell membrane. Cell size is smaller in cells expressing Atg5-RNAi under the control of pros-GAL4 compared to the lacZ expressing control cells (Figure 2E). (B) Quantification of cell size by measurement of the area outlined by Pyd staining in the cross-sectional plane in conditions analogous to (A and Figure 2E). Data shows mean ± standard deviation, n = 9 animals per genotype with three cells for each animal (every dot and square represents one animal here and throughout the figure). Statistical difference was assessed by unpaired t-test, p < 0.0001 (****) for Atg5-RNAi. (C) Nephrocyte labyrinthine channels are visualized by passive FITC-albumin tracer diffusion into the channels after brief fixation. Channels are shortened in cells expressing Atg5-RNAi compared to the lacZ expressing control cells (Figure 3E). (D) Quantification of labyrinthine channel depth analogous to conditions in ((C) and Figure 3E) based on three representative measurements in sections of the cell surface that are not in immediate proximity to a neighboring cell. Data shows mean ± standard deviation, n = 9 animals per genotype with three cells for each animal. Statistical difference was assessed by unpaired t-test, p < 0.01 (**) for Atg5-RNAi. (E) Actin marker phalloidin shows a regular peripheral actin network in lacZ expressing control cells (Figure 3A) with linear cortical actin and the adjoining subcortical actin network. Expression of Atg5-RNAi does not alter the peripheral actin network. (F) The quantification of the fraction of the cellular area in the cross-sectional plane that is covered by the peripheral actin network for the conditions analogous to ((E) and Figure 3A). Data shows mean ± standard deviation, n = 9 animals per genotype with three cells for each animal. Statistical difference was assessed by unpaired t-test, p > 0.05 (ns) for Atg5-RNAi. (G) The expression of EGFP with a nuclear localization signal (EGFPNLS) under control of a 2 kb enhancer region of the Drosophila sns promoter reflects endogenous sns expression levels in nephrocytes. The expression of Atg5-RNAi leads to increased EGFPNLS levels compared to control cells expressing lacZ (Figure 2A). (H) The quantification of nuclear EGFP-derived fluorescence intensity is normalized to the average of lacZ expressing controls and shown for the indicated genotypes (G and Figure 2A). Data shows mean ± standard deviation as an average of the three brightest representative cells from one animal, n = 16–19 animals per genotype. Statistical difference was assessed by unpaired t-test, p < 0.0001 (****) for Atg5-RNAi. (I) Fragmented DNA, which associates with cell death, is reflected by TUNEL staining. Cells expressing Atg5-RNAi show elevated levels of TUNEL-positive nuclei compared to cells expressing a control RNAi (Figure 2K). (J) Quantification of the fraction of TUNEL-positive nuclei in conditions analogous to ((I) and Figure 2K). Data shows mean ± standard deviation, n = 9–10 animals per genotype with 18–23 cells on average for each animal. Statistical difference was assessed by unpaired t-test, p < 0.05 (*) for Atg5-RNAi. (K) Nephrocyte function is visualized by the FITC-albumin endocytosis assay. The expression of Atg5-RNAi does not alter tracer uptake compared to control cells (Figure 3K). (L) Quantification of FITC-albumin-derived fluorescence intensity is normalized to the average of a lacZ expressing control experiment performed in parallel and shown for the indicated genotypes ((K) and Figure 3K). Data shows mean ± standard deviation as an average of the three brightest representative cells from one animal, n = 21–27 animals per genotype. Statistical difference was assessed by unpaired t-test, p > 0.05 (ns) for Atg5-RNAi. (M–M’’) Nephrocytes were co-stained for Sns (nephrin) and Pyd (ZO-1). Magnified regions of the tangential section are shown in the upper insets, and surface details from cross-sections in the lower insets. Cells expressing Atg5-RNAi display the regular slit diaphragm fingerprint pattern of control cells expressing lacZ (Figure 1C–C’’). (N) Quantification of the distance between two slit diaphragms is shown analogous to conditions in (M–M’’ and Figure 1C–C’’). Distances were measured along a linear path representing the widest diameter of individual cells. Data shows mean ± standard deviation, n = 9 animals per genotype with three cells for each animal. Statistical difference was assessed by unpaired t-test, p > 0.05 (ns) for Atg5-RNAi.

