Figure 2.
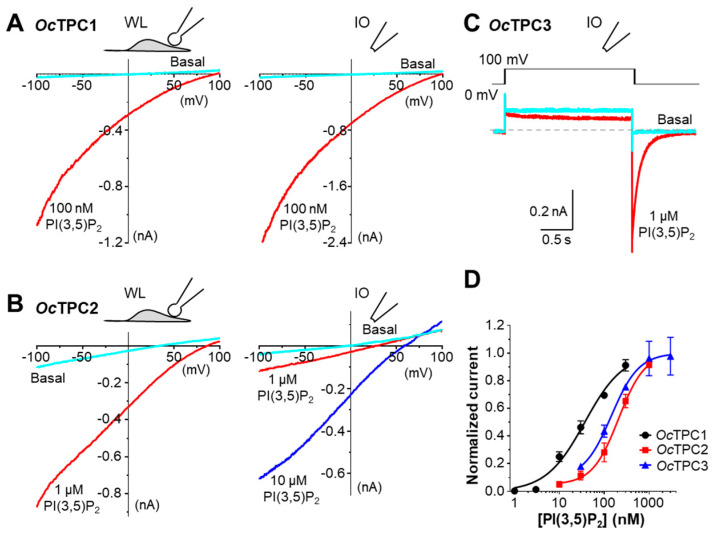
Rabbit TPC1, TPC2, and TPC3 are activated by PI(3,5)P2. HEK293 cells transiently transfected with cDNA coding for OcTPC1-EGFP, OcTPC2-EGFP, or OcTPC3-EGFP as indicated were used for voltage-clamp recording using either whole-endolysosome (WL) or inside-out (IO) configurations. (A,B) Representative current–voltage (I–V) curves obtained from voltage ramps for WL (left) and IO (right) patches from cells that expressed OcTPC1 (A) or OcTPC2 (B). The patches were untreated (Basal) or exposed to PI(3,5)P2 at the indicated concentrations in the bath. (C) Representative current traces detected in an IO patch excised from a cell that expressed OcTPC3. The voltage was stepped from the holding potential at 0 mV to +100 mV for 2 s before returning to 0 mV. Dashed line indicates zero current. Note the large tail current in the presence of PI(3,5)P2 (red trace) in the bath. The square response to +100 mV step under basal conditions (cyan trace) represents leak, unrelated to OcTPC3 function. (D) Concentration–response curves to PI(3,5)P2 for OcTPC1, OcTPC2, and OcTPC3, determined using IO (for OcTPC1 and OcTPC3) and WL (for OcTPC2) patches. Data are means ± SEM for n = 7 patches for each. Solid lines represent fit to the Hill equation.

