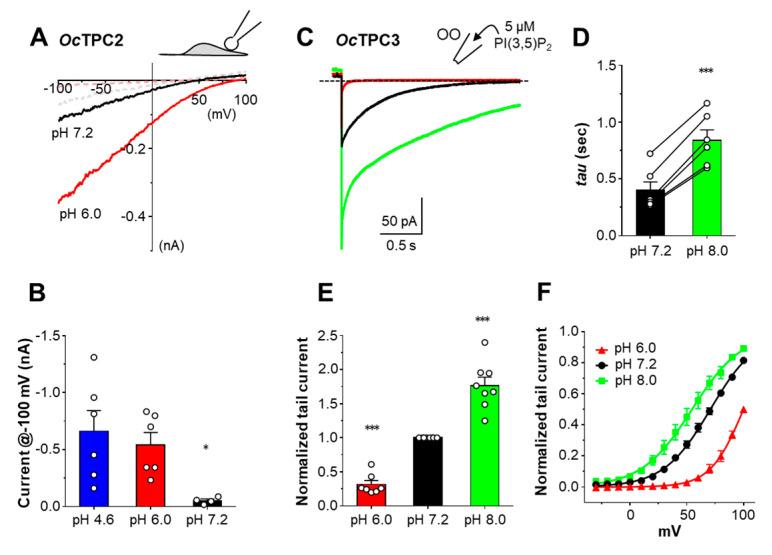
Figure 7.
OcTPC2 prefers acidic pH, while OcTPC3 is more active at alkaline extracytosolic pH. HEK293 cells were transiently transfected with cDNA coding for OcTPC2-EGFP or OcTPC3-EGFP. (A) Representative I–V curves derived from voltage ramps for OcTPC2 in whole-endolysosome (WL) patches with pipette solutions having pH 7.2 and pH 6.0. The patch was unstimulated (dashed lines) or exposed to 1 µM PI(3,5)P2 (solid lines). Traces from two different patches were overlaid for comparison between pH 6.0 and pH 7.2. See Figure 2B left for an example of pH 4.6. (B) Summary of current amplitude at −100 mV recorded as in (A). Data are means ± SEM for n = 4–6 patches, with individual data points shown as while circles. * p < 0.05, different from pH 4.6 by one-way ANOVA with Tukey’s multiple comparisons test. (C) Representative current traces of OcTPC3 detected in an outside-out (OO) patch with the pipette solution containing 5 µM PI(3,5)P2 and the patch sequentially exposed to pH 7.2 (black), pH 6.0 (red), and then pH 8.0 (green) bath solutions. The voltage was stepped from the holding potential at 0 mV to +100 mV for 4 s before returning to 0 mV. For clarity, only the last 0.14 s of the +100-mV step is shown together with the tail currents at 0 mV. Dashed line indicates zero current. (D) Summary of inactivation time constant (tau) for tail currents at pH 7.2 and pH 8.0 for OcTPC3 recorded as in (C). Data are means ± SEM for n = 6 patches. *** p < 0.001 by paired t-test. (E) Summary of tail current normalized to that at pH 7.2 for OcTPC3 recorded as in (C). Data are means ± SEM for n = 7–8 patches. *** p < 0.001, different from the theoretical mean of 1 by one-sample t-test. (F) G–V curves for patches recorded as in (C) but with tail currents obtained after step pulses to different potentials. Data are means ± SEM for n = 6 (pH 7.2, same data from Figure 5F), n = 4 (pH 8.0), and n = 3 (pH 6.0) patches fit by the Boltzmann function.

