Figure 1.
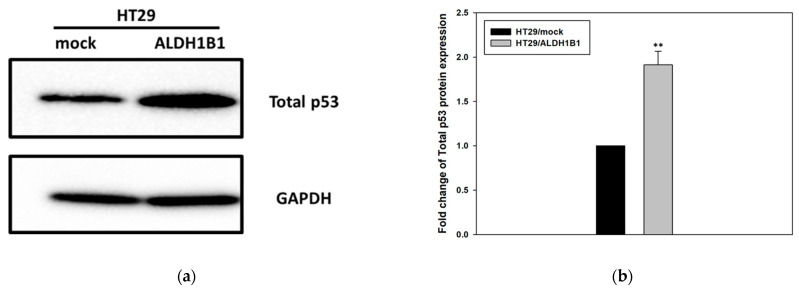
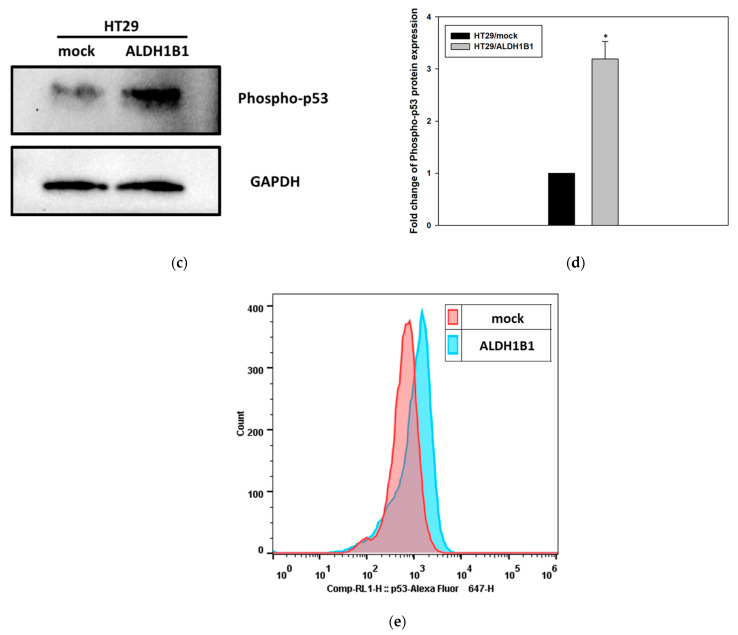
ALDH1B1 induces the upregulation of the total and phosphorylated form of p53 protein in HT29 cells. (a,c) Forty (40) μg of HT29/ALDH1B1 and HT29/mock cell extracts were subjected to western blot analysis against total p53 and p53 phosphorylation. GAPDH was used as a control for equal loading. (b,d) The translational expression levels of total and phosphorylated (ser15) p53 were ~2-fold and >3-fold, respectively; they were higher in ALDH1B1-expressing cells compared to mock control HT29 cells. (e) The ALDH1B1 histogram (light-blue color) had appreciably right-shifted in comparison with HT29/mock cells (pink color), demonstrating the increased total p53 expression levels in ALDH1B1-overexpressing cells. At least 20,000 events were analyzed through flow cytometry, and the median fluorescence intensity for total p53 was determined in both cell lines (Table 1). The above graphs are representative of an experiment. At least three independent experiments were performed for each condition. * p < 0.05, ** p < 0.01.


