Figure 5.
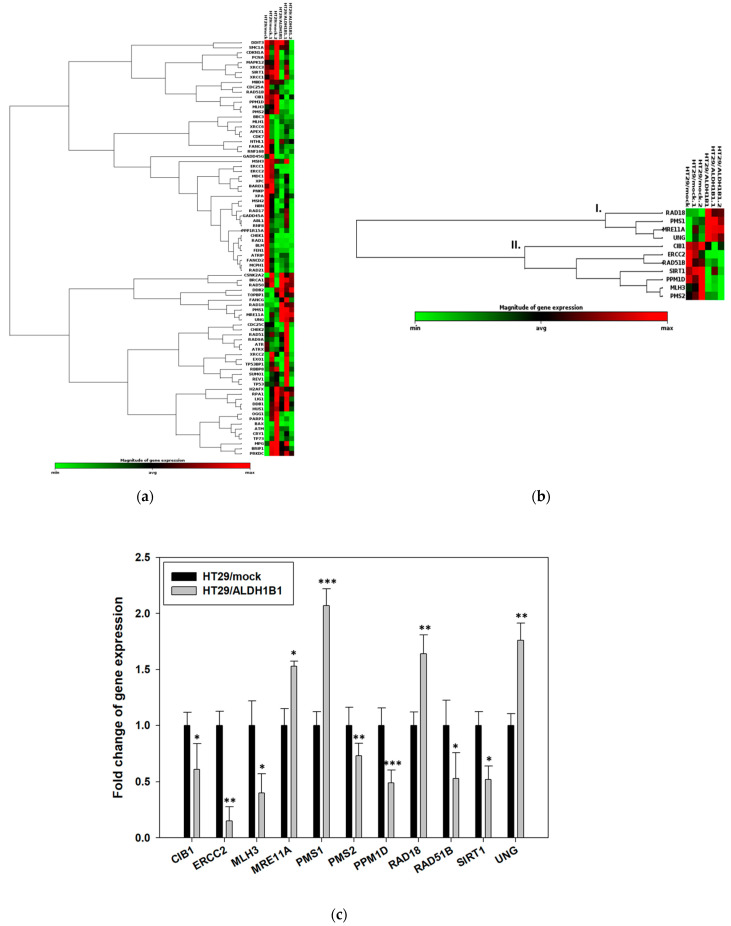
ALDH1B1 promotes alterations in the gene expression profile of a panel of DNA damage signaling genes in HT29 cells. Total RNA was extracted from the HT29 isogenic cell line pair, and the RT2 Profiler™ PCR Array for Human DNA Damage Signaling Pathway (PAHS-029ZA) was utilized to determine the expression profile of 84 different DNA damage signaling (DDS)-related genes. (a) The clustergram displays a heat map indicating the magnitude of gene expression along with a dendrogram, which organizes genes in proportion to their expression pattern. The color saturation indicates the magnitude of gene expression. Red squares indicate higher expression, black squares indicate no change, and green squares indicate lower expression. The x-axis shows the HT29/ALDH1B1 and HT29/mock samples of the three independent experiments, whereas the y-axis represents the PCR array genes. (b) Genes of cluster I (MRE11A, PMS1, RAD18 and UNG) exhibited upregulation, whereas genes of cluster II (CIB1, ERCC2, MLH3, PMS2, PPM1D, RAD51B and SIRT1). (c) Genes MRE11A, PMS1, RAD18 and UNG were found to be up-regulated in HT29/ALDH1B1 cells (fold change of expression (≥1.5)), whereas CIB1, ERCC2, MLH3, PMS2, PPM1D, RAD51B and SIRT1 exhibited negative regulation in the ALDH1B1-overexpressing HT29 cells. Five different housekeeping genes were used for normalization (ACTB, B2M, GAPDH, HPRT1 and RPLP10) of gene expression. Results are shown as mean ± S.D. Three independent experiments were performed for each sample. * p < 0.05, ** p < 0.01, *** p < 0.001.

