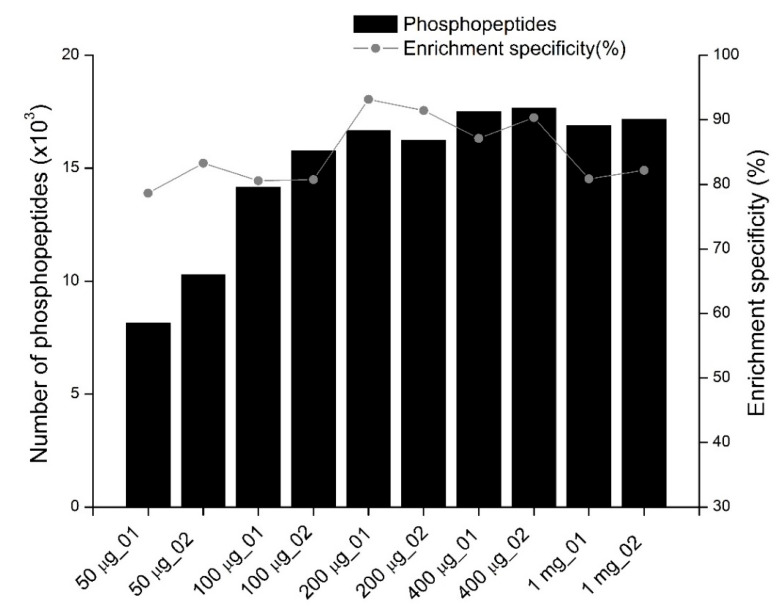
Figure 1.
The profiles of phosphopeptides identified from samples in which different amounts of peptides are used for phosphopeptide enrichment. The bar and the curve indicate the number of phosphopeptides identified and the phosphopeptide enrichment specificity (the number of phosphopeptides identified divided by the total peptides identified in each experiment), respectively. The x-axis shows the amounts of peptides used for phosphopeptide enrichment. Two replicates are performed for each condition. For all experiments, phosphopeptides are purified with TiO2 using lactic acid as a non-phosphopeptide excluder.

