Figure 3.
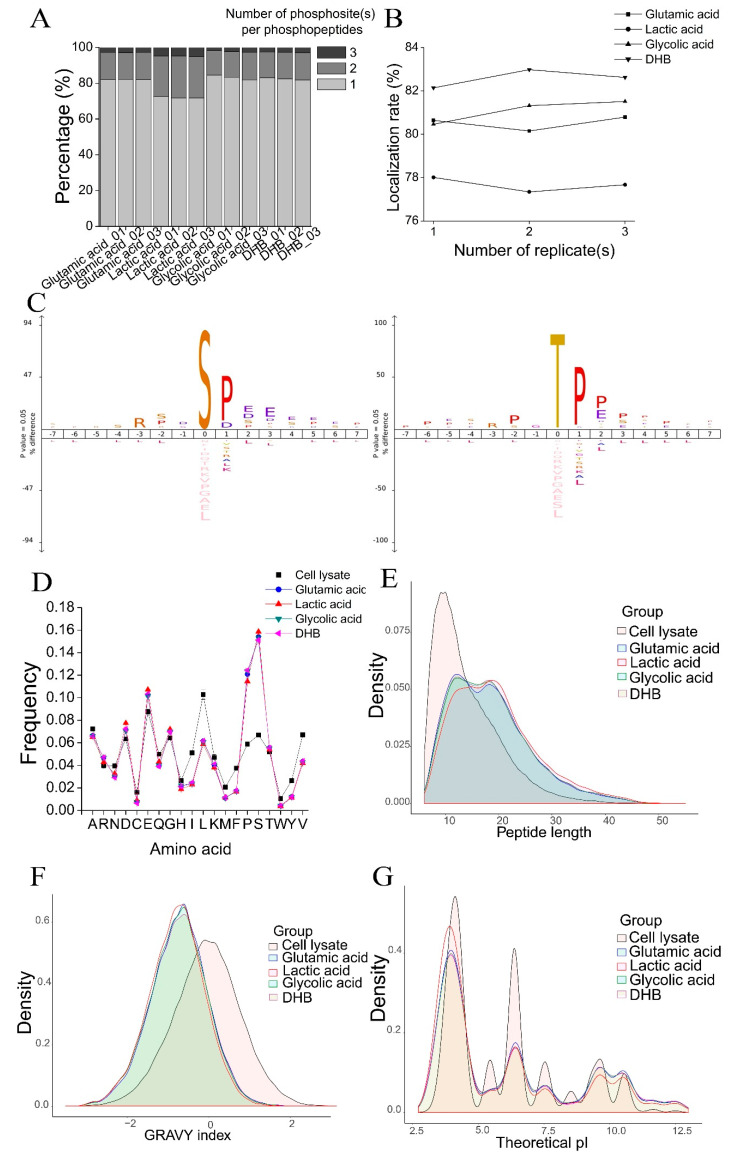
Comparison of the physicochemical characteristics of phosphopeptides identified with the four TiO2−based phosphopeptide enrichment methods. (A) The percentages of singly phosphorylated, doubly phosphorylated, and triply phosphorylated peptides in the three replicates of the four methods. (B) The phosphopeptide localization rate (the percentage of phosphopeptides with fully−localized phosphosites) in the three replicates of the four methods. (C) The iceLogo sequence motif analysis of phosphopeptide sequence windows (p < 0.05). S represents amino acid serine; T represents amino acid threonine; P represents amino acid proline, D represents amino acid aspartic acid, E represents amino acid glutamic acid. The height of amino acid letters corresponds to the percentage. (D) The amino acid composition of peptides from cell lysate (the starting material) and phosphopeptides identified with the four methods. Error bars indicate standard deviation (SD). (E–G) The distribution of peptide length (E), GRAVY index (F), and theoretical pI (G) of peptides from cell lysate and phosphopeptides identified with the four methods.

