Figure 6.
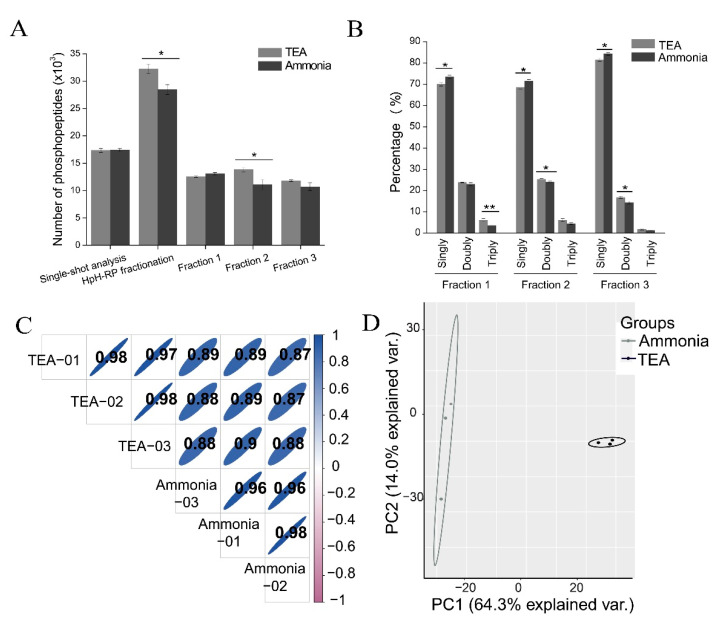
Comparison of the ammonia-based and TEA-based HpH-RP fractionation methods. (A) The number of phosphopeptides identified in single-shot analysis (before HpH-RP fractionation), after the ammonia-based and TEA-based HpH-RP fractionation, and three fractions of the ammonia-based and TEA-based HpH-RP fractionation (Fraction 1-3). Bars show mean ±SD of three replicates; * p < 0.05 (Student’s t-test). For all experiments, phosphopeptides are purified with TiO2 using lactic acid as a non-phosphopeptide excluder. (B) The percentage of singly phosphorylated, doubly phosphorylated, and triply phosphorylated peptides in the three fractions of the ammonia-based and the TEA-based HpH-RP fractionation. Bars show mean ±SD of three replicates; * p < 0.05, ** p < 0.01 (Student’s t-test). (C) Pearson correlation plot of three replicates of the ammonia-based and TEA-based HpH-RP fractionation. (D) PCA analysis of three replicates of the ammonia-based and TEA-based HpH-RP fractionation.

