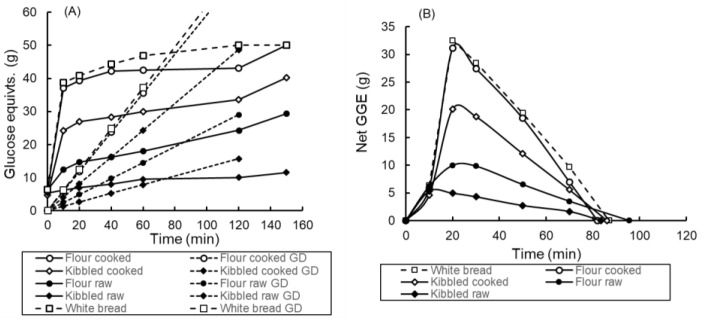
Figure 1.
(A) Digestogram for porridge samples (all 50 g potentially available carbohydrate) differing in particle intactness and cooking. Samples were homogenised at 120 min and digestion continued to 150 min. Points are means of duplicate samples. Mean absolute deviation from mean = 1.2 g. Glucose disposal (GD) baselines corresponding to each digestion curve are shown. (B) Net glycaemic glucose equivalents were determined from the difference between each digestion curve and its corresponding GD baseline in Figure 1A. Potential available carbohydrate content was assumed to be that measured in the cooked homogenised flour sample at 150 min digestion.

