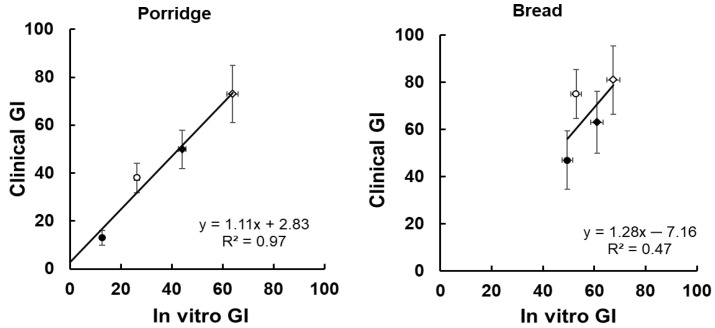
Figure 3.
Correlations between GI values determined in vitro and in vivo [1,2], for porridges and bread. For clinical values (y axis) means ± SEMs are shown. For in vitro values (x-axis) error bars are analytical SDs based on average CVs of 3.5% (porridge) and 3.8% (bread). Porridges: fine cooked (◊), coarse cooked (♦), fine raw (○), coarse raw (●). Bread: roller milled flour (◊), stoneground flour (♦), kibbled grain/stone ground flour (○), intact grain/kibbled grain/stoneground flour (●).

