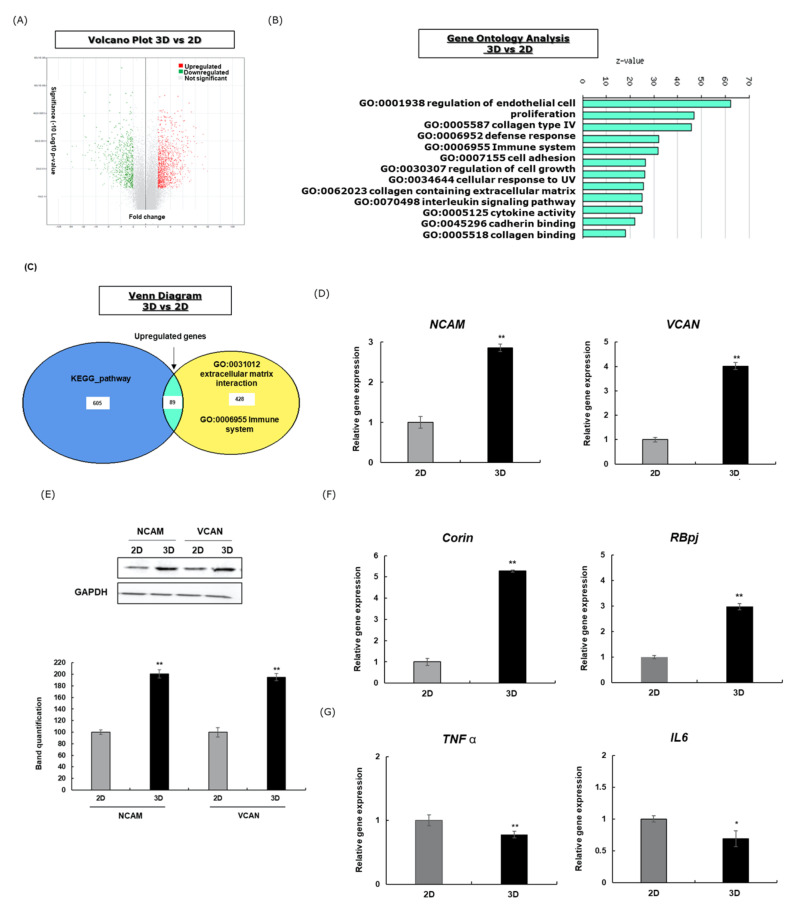
Figure 1.
The gene profiling analysis of HFDPCs cultured in 3D spheroids vs. 2D monolayer. (A) Volcano plot showing the DEGs. Red, green, and grey illustrate the upregulated, downregulated, and nonsignificant DEGs, respectively. (B) The top 12 significantly enriched biological processes by the upregulated DEGs (analysed using Ex atlas). (C) Venn diagram showing common and unique sets of DEGs. (D) The gene expression of VCAN and NCAM after 48 h. (E) VCAN and NCAM protein expression after 48 h. Band intensities were assessed using LICOR. The results represent the mean ± SD of three independent experiments. * p ≤ 0.05, ** p ≤ 0.01. (F) The gene expression of DPC marker CORIN and, Notch pathway effector RBbj after 48 h. (G) Gene expression of inflammation associated genes after 48 h. The mRNA level was quantified using TaqMan real-time PCR.

