Figure 4.
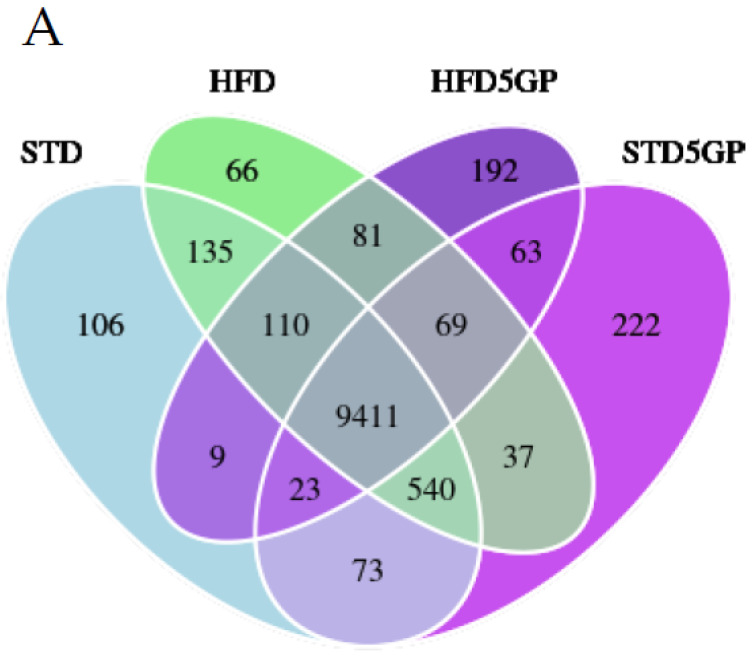
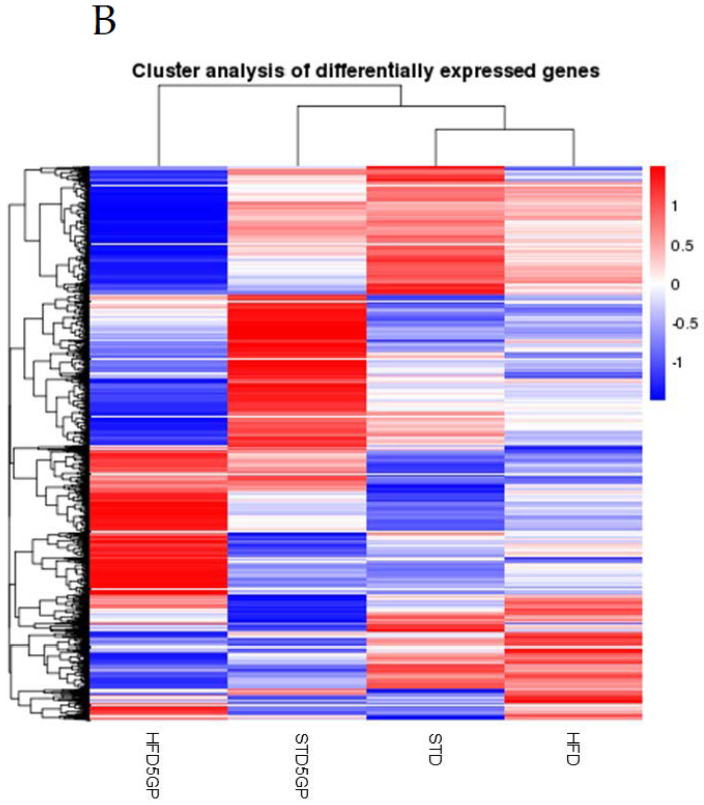
Dietary fat content and grape powder supplementation alters gene expression profiles in mouse liver. (A) Venn diagram of genes expressed by the four groups of mice illustrating genes co-expressed (overlapping regions) and uniquely expressed (non-overlapping regions) among all groups. The default threshold of FPKM value is set to 1 for the selection of the genes for each group. (B) Heat map and cluster analysis showing unique gene expression profiles for each of the four groups of mice. Clustering analysis was carried out by Novogene Corporation Inc. (Sacramento, CA, USA) using a build-in R package, heatmap. Focus is placed on data (Union_for_cluster.xls) which is the union gene set of all comparison groups. Relative gene expression levels and −log2(ratios) are used for clustering. The clustering calculates the distance between each gene and evaluates the relative gene distance through iteration. Finally, genes are divided into several subgroups according to gene distance. H-cluster, K-means and SOM are the main clustering methods used, implemented in R language (Version 1.0.12).


