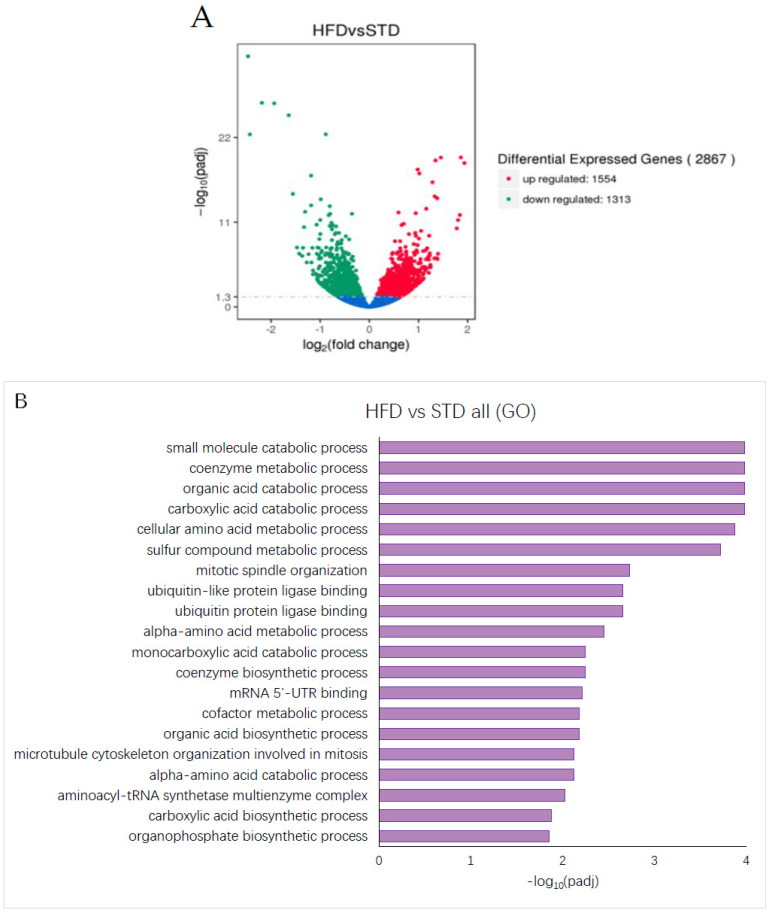
Figure 5.
HFD alters gene expression in mouse liver. (A) Volcano plot showing upregulated (red dots) (1554), downregulated (green dots) (1313) and unaltered (blue dots) genes in liver derived from the HFD group compared to the STD group. The threshold for differentially expressed genes was set as |log2(fold-change)| > 1 and −log10(Padj) > 1.3 (Padj < 0.05). The plot illustrates the upregulation of 1554 genes and the downregulation of 1313 genes. (B) GO analysis showing significantly enriched terms for the gene set differentially expressed in the liver of mice from the HFD group compared to the STD group. −log10(Padj) > 1.3 (Padj < 0.05) was considered as significant enrichment.

