Figure 4.
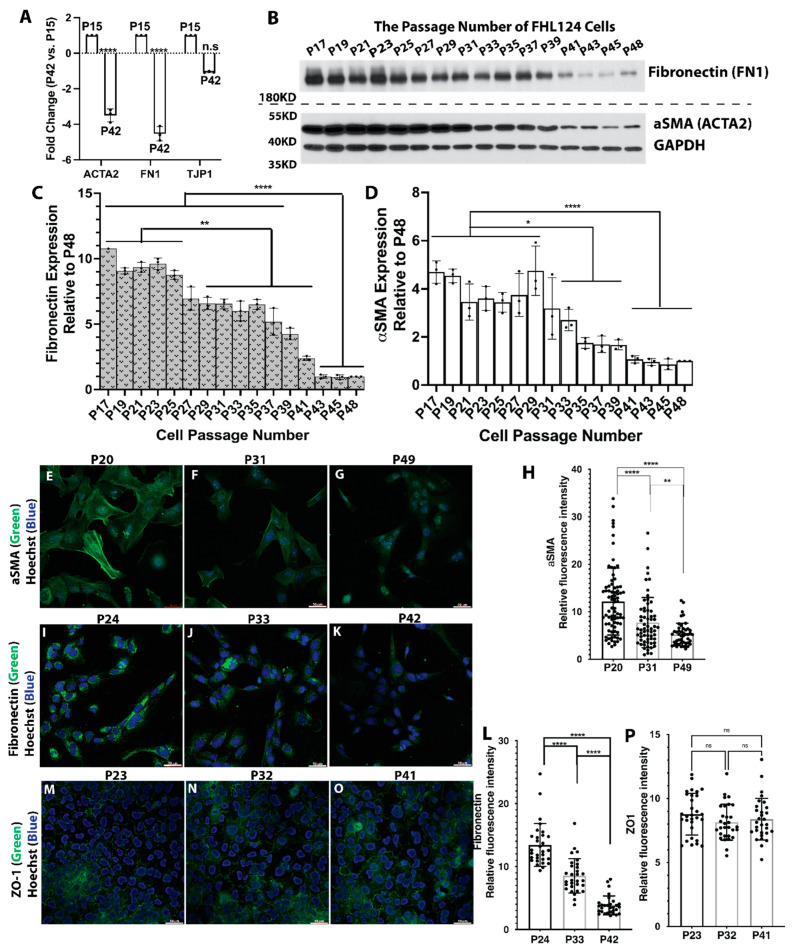
Fibronectin and αSMA protein expression gradually decreased in LECs aging. (A) Relative mRNA expression of fibronectin and αSMA between P42 and P15 passage FHL124 cells. Data are expressed as fold change relative to P15. (B) Fibronectin and αSMA protein levels from passage 17 to passage 48 FHL124 cells (n = 3). GAPDH serves as a loading control. (C) Semi-quantitative results of fibronectin expression from immunoblot (B) (n = 3). (D) Semi-quantitative results of αSMA expression from immunoblot (B) (n = 3). (E–P) immunofluorescence staining of fibronectin, αSMA, and ZO-1 protein expression in early, middle, and late passage LECs. (E–G) αSMA IF: αSMA (green), nuclei (blue) by Hoechst 33342. (E) Passage 20. (F) Passage 31. (G) Passage 49. (I–K) Fibronectin IF: fibronectin (green), nuclei (blue). (I) Passage 24. (J) Passage 33. (K) Passage 42. (M–O) ZO-1 IF: ZO-1 (green), nuclei (blue). (M) Passage 23. (N) Passage 32. (O) Passage 41. (H) Quantitative results of αSMA protein expression based on fluorescence intensity. Fluorescence intensity from 50 cells was measured. (L) Quantitative results of fibronectin protein expression based on fluorescence intensity. Fluorescence intensity from 50 cells was measured. (P) Quantitative results of ZO-1 protein expression based on fluorescence intensity. Fluorescence intensity from 50 cells was measured. Results are expressed as mean ± SD and were analyzed using one-way ANOVA with Tukey’s multiple comparisons test. Only p < 0.05 is considered significant. * < 0.05, ** < 0.01, *** < 0.001, **** < 0.0001; n.s, not significant.

