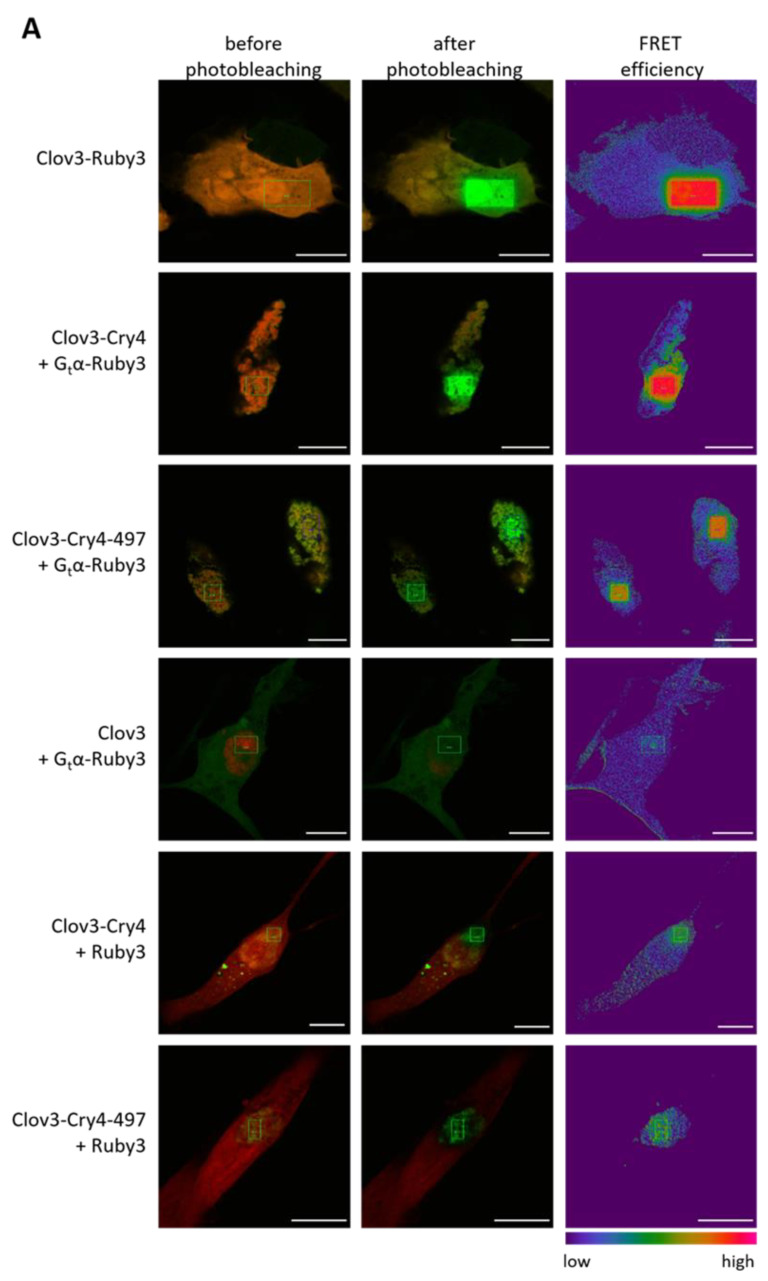
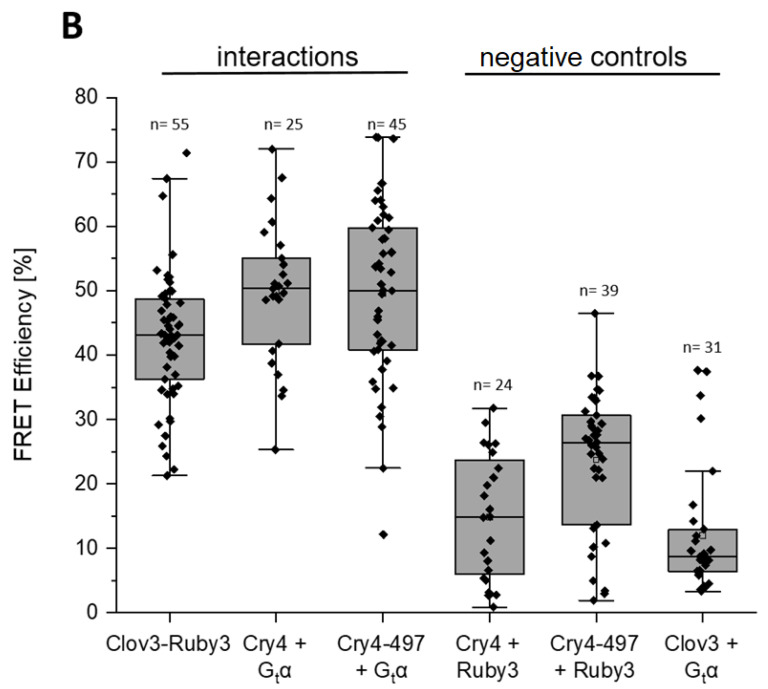
Figure 4.
Interaction between Gtα and ErCry4a with and w/o C-terminus (ErCry4-497) using the acceptor photobleaching FRET technique. (A) Representative confocal laser scanning microscopy images of QNR/K2 cells before and after photobleaching (overlay of red-donor and green-acceptor), and FRET efficiencies. Expressed proteins as indicated. The green rectangular indicates the bleached area. Scale bar is 10 µm. (B) FRET efficiencies as determined by the LAS AF software between N-terminally tagged Cry4 (or the truncated version Cry4-497) with mClover3 (Clov3) and Gtα, C-terminally tagged with mRuby3 (Ruby3), including negative and positive controls. Boxplot graphs were generated using Origin graph software. The boxes range from Q1 (the first quartile) to Q3 (the third quartile) of the data distributions, and the range represents the IQR (interquartile range). Medians are indicated by lines across the boxes. The whiskers extend between the most extreme data points, excluding outliers, which are defined as being outside 1.5 × IQR above the upper quartile and below the lower quartile. Each data point represents the measurement for one cell, with n indicating total cell numbers measured in each condition. Each condition was tested in at least three separate experiments.


