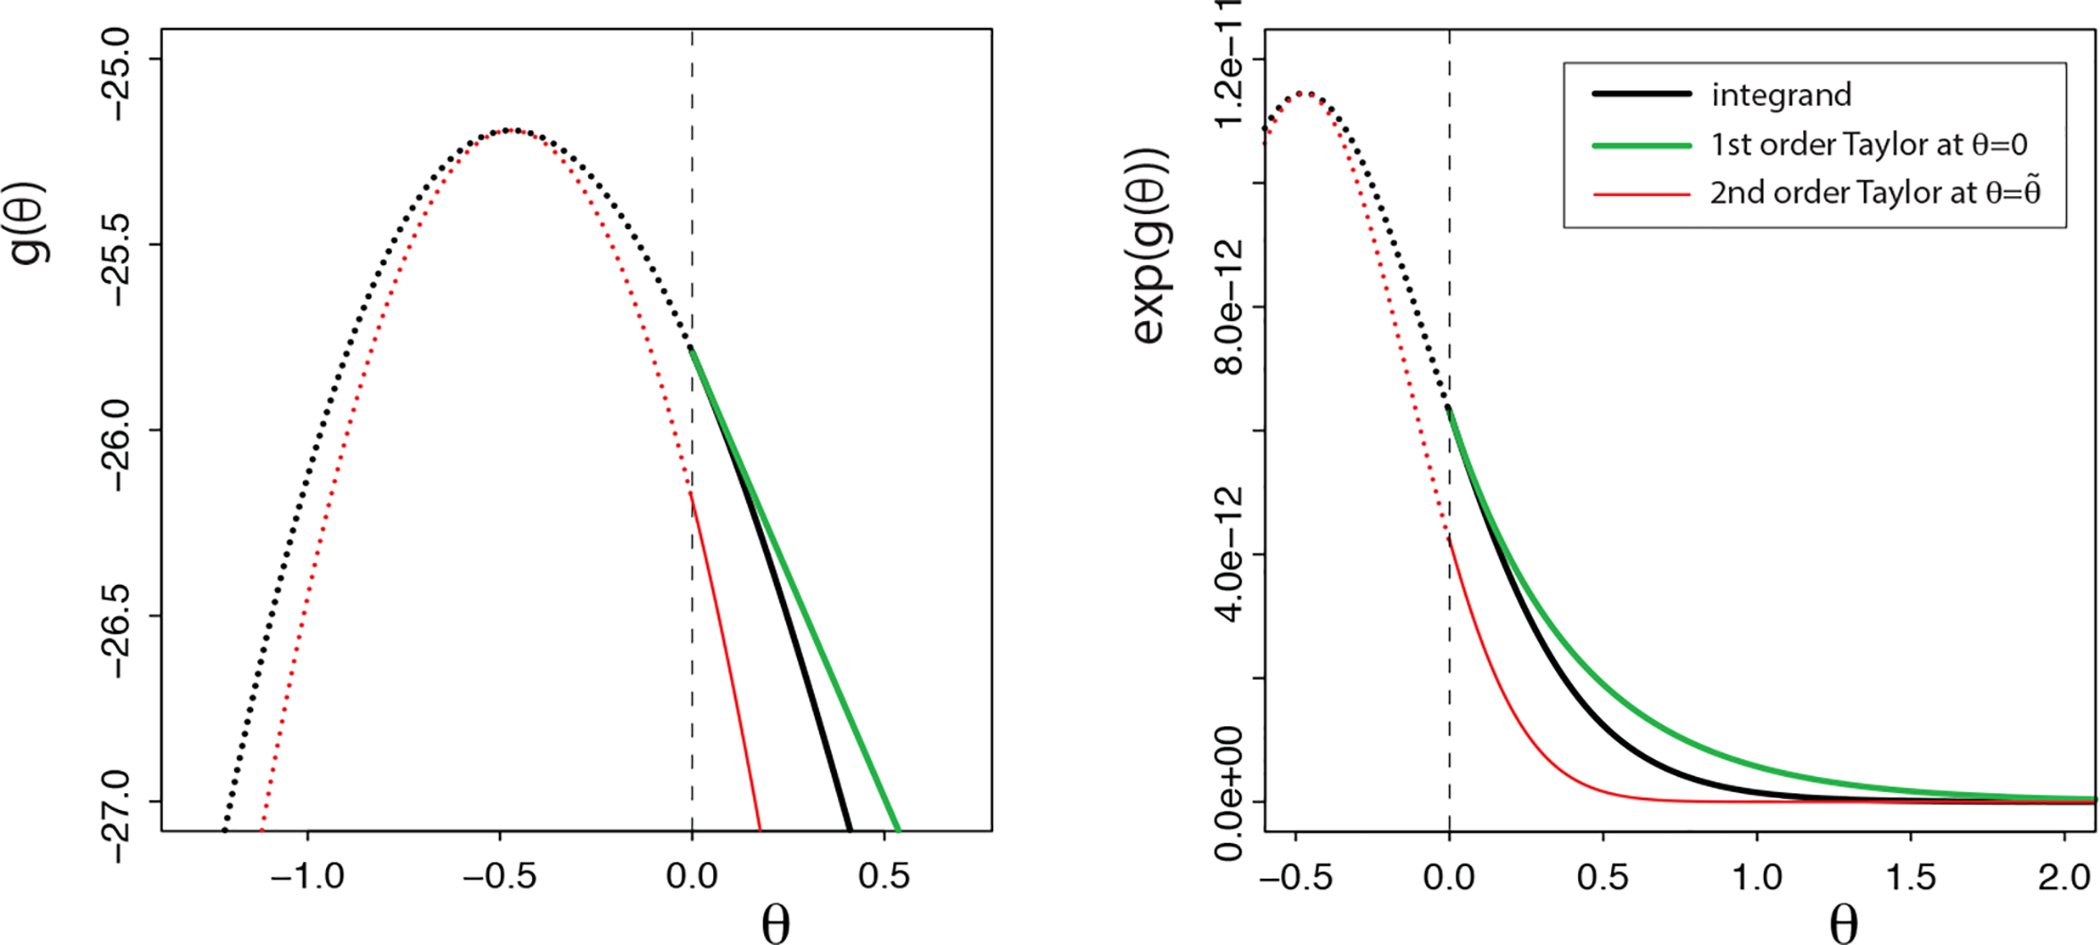
Figure 1:

Plot of the log of prior times likelihood, g(θ), (black line), first-order Taylor approximation at θ = 0 (green line), and second-order Taylor approximation around the unconstrained posterior mode of (red line), for an inequality-constrained model M1 : θ ≥ 0. The left panel displays the functions of the log scale and the right panel on the regular scale. The inequality-constrained region under M1 : θ ≥ 0 has solid lines, and the complement region has dotted lines.
