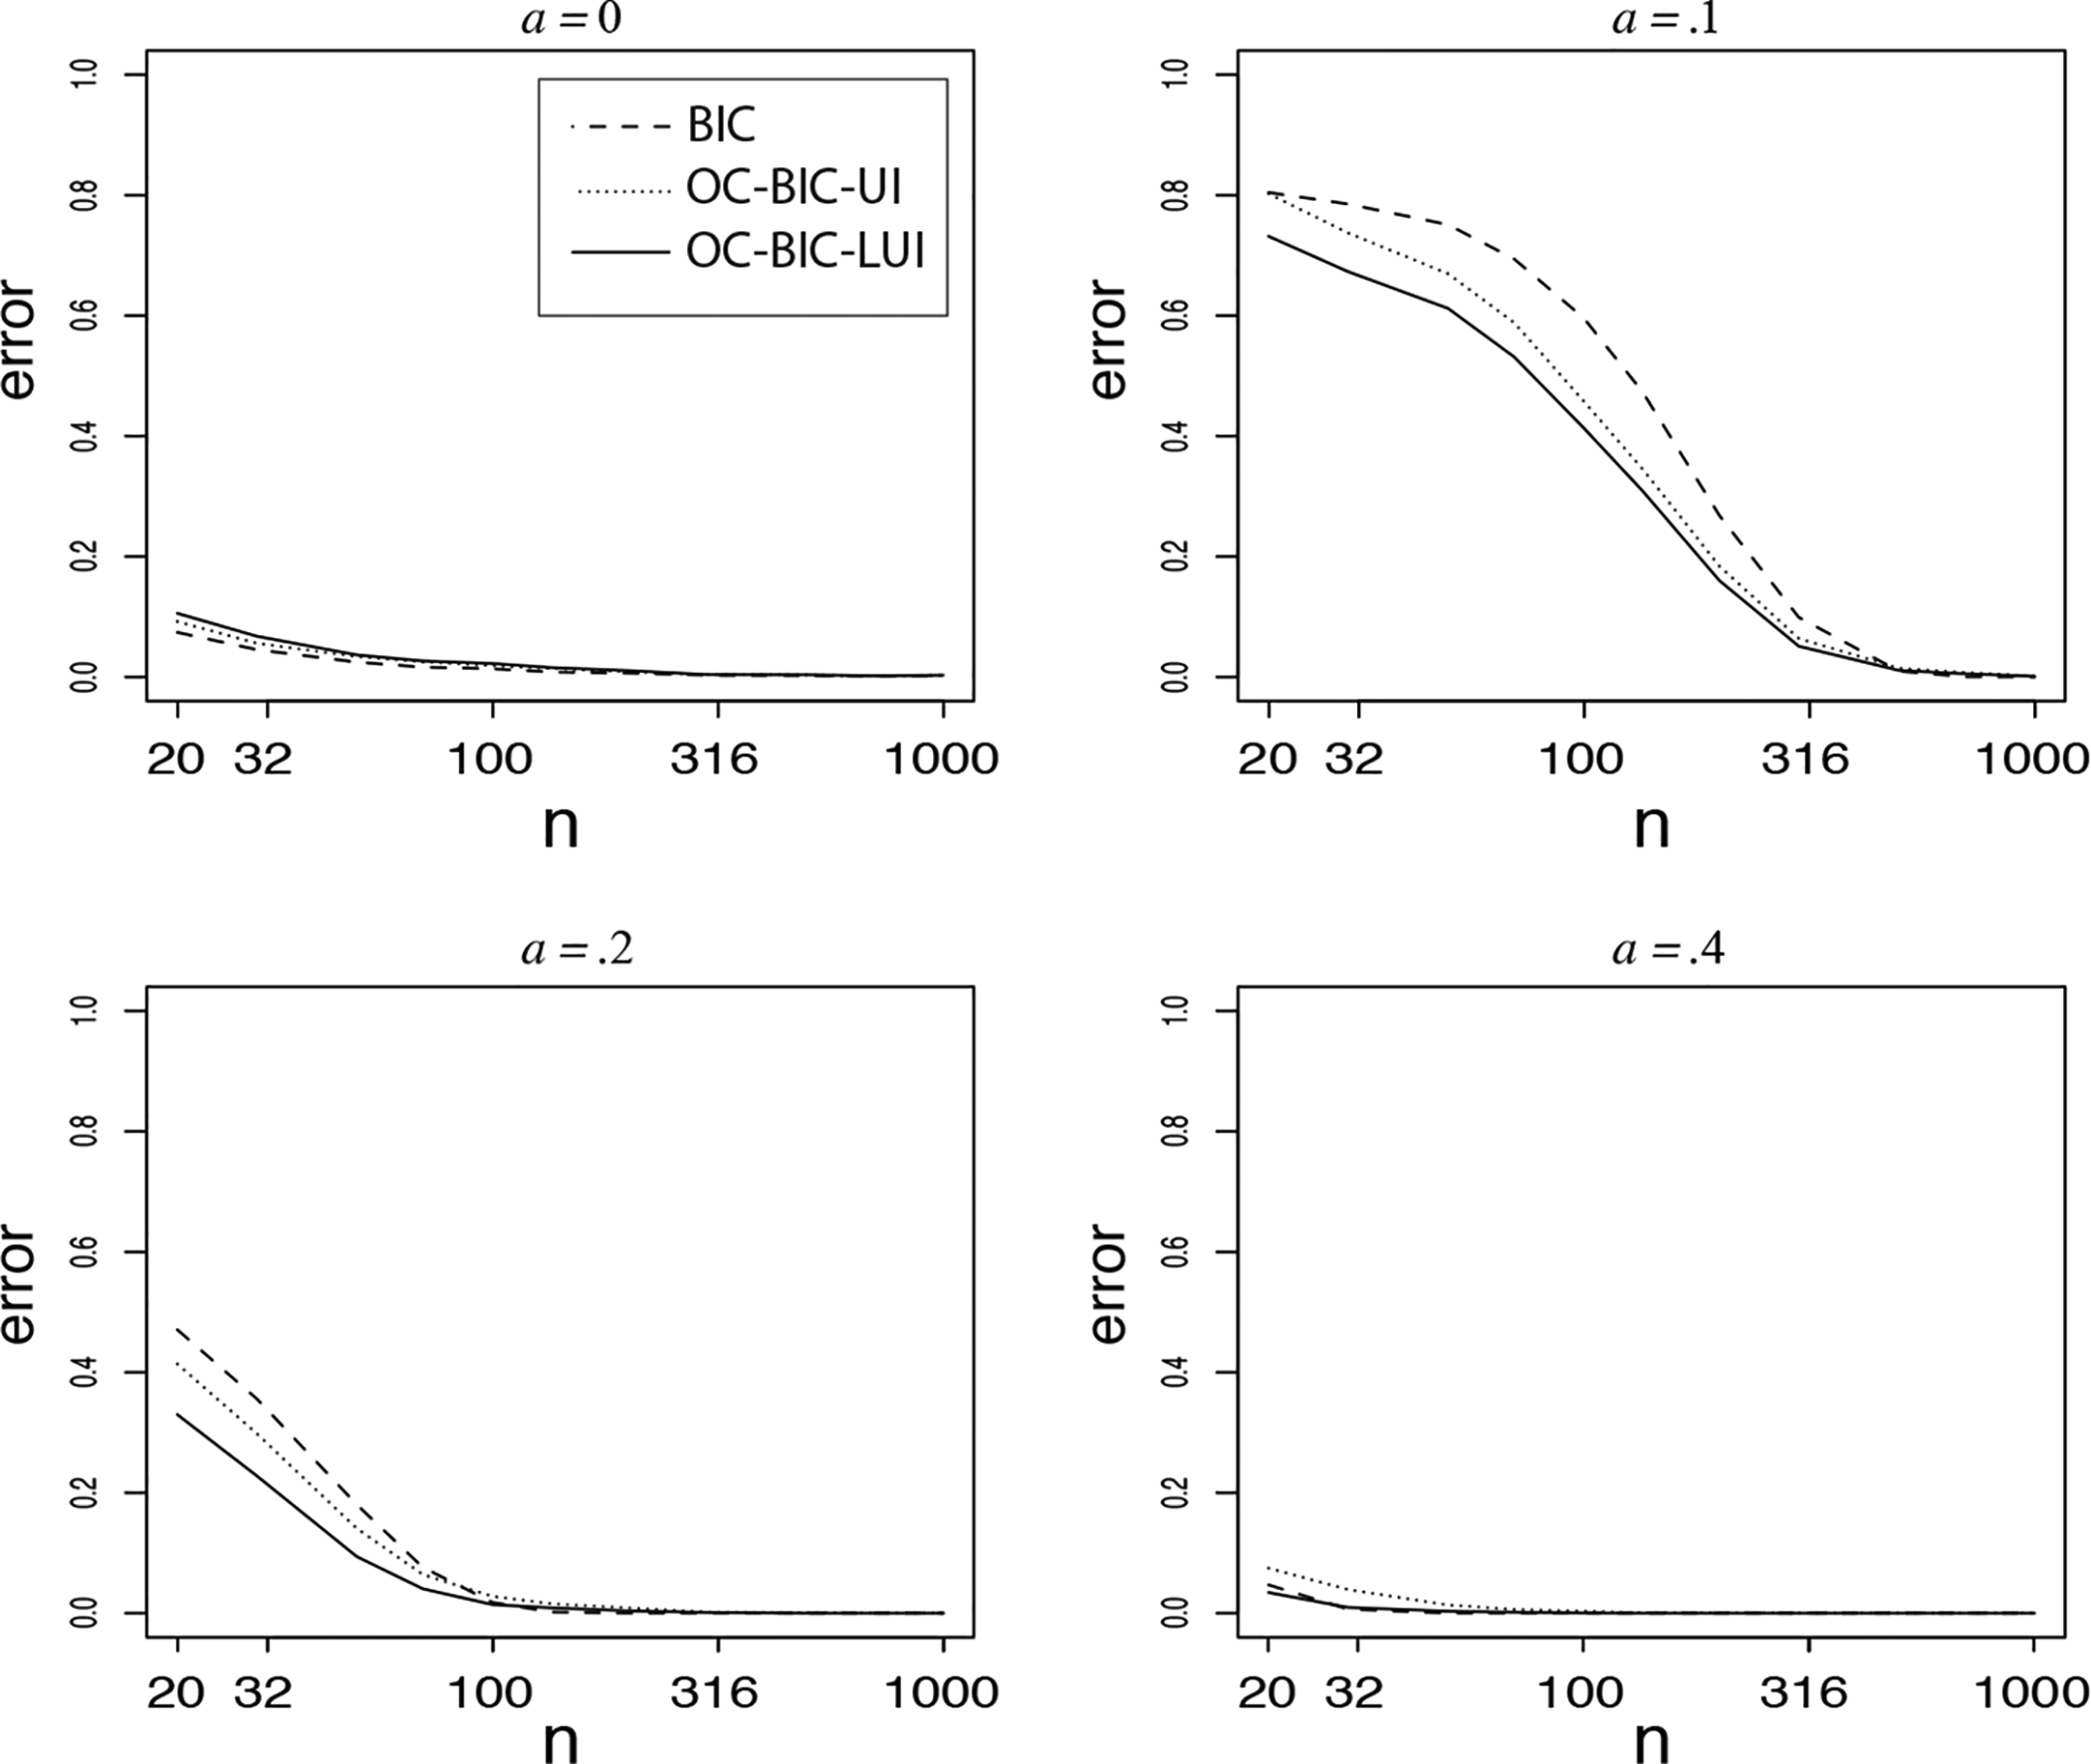
Figure 3:

Probability of selecting the wrong model when using the ordinary BIC for testing M0 : θ1 = θ2 = 0 against (dashed line), and the two order-constrained BICs when testing M0 : θ1 = θ2 = 0, M1 : θ2 > θ1 > 0, and M2 : θ2 ≱ θ1 ≱ 0 (dotted and solid line for the non-local and local unit-information prior, respectively) for true effects of (θ1, θ2) = (a, 2a), for a = 0, .1, .2, and .4. The sample size on the x-axis is on a logarithmic scale.
