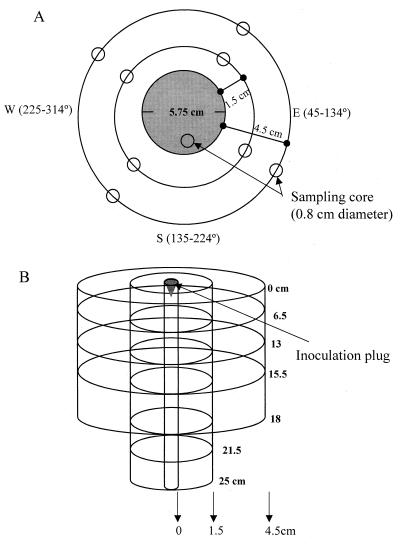
FIG. 1.
Diagram of sampling strategy and field plot inoculated with P. fluorescens strains Pf0-2 and Pf0-5a. (A) Top view of plot. The inoculation plug (shaded area) consisted of a cone with a diameter of 5.75 cm and a volume of 41 ml. The four cardinal points were established just beyond the outer ring of the plots. Sampling sites at test distances (1.5 and 4.5 cm) were determined by using a compass clockwise and randomly picking an angle between 315 and 44°, 45 and 134°, 135 and 224°, and 225 and 314° for north, east, south, and west, respectively. Rings indicating distances away from the site of inoculation were demarked with toothpicks. Distances of 13.5 and 40 cm from the point of inoculation were also tested, but no test organisms were detected. Plug is drawn to scale. (B) Side view of field plot. Movement of the strains below the site of inoculation was measured in soil fractions of depths (in centimeters) of 0 to 2, 2 to 6.5, 6.5 to 13, 13 to 15.5, 15.5 to 18, 18 to 21.5, and 21.5 to 25. Movement of the strains from the site of inoculation was measured at distances of 1.5 and 4.5 cm from the site and at depths of 0 to 6.5, 6.5 to 13, 13 to 15.5, 15.5 to 18, 18 to 21.5, and 21.5 to 25 cm below the inoculation site. Side view is not drawn to scale.

