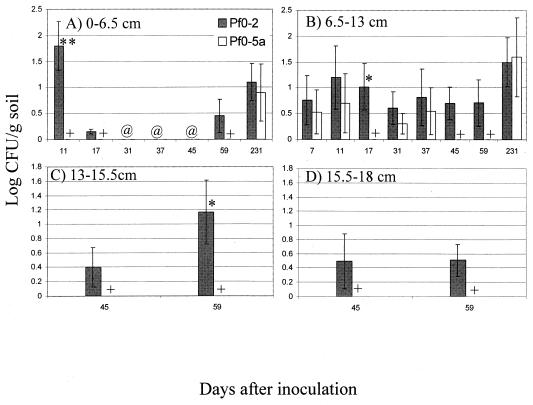
FIG. 4.
Soil populations of P. fluorescens strains Pf0-2 (wild type) and Pf0-5a (adnA mutant) at different depths 4.5 cm from the point of inoculation: 0 to 6.5 cm (A), 6.5 to 13 cm (B), 13 to 15.5 cm (C), and 15.5 to 18 cm (D). Strains were inoculated and enumerated as described for Fig. 3. Means were determined from four replicates. Significant differences were determined by ANOVA. ∗, ∗∗, statistically significant differences between soil populations of the two strains at P ≤ 0.1 and 0.05, respectively; +, no Pf0-5a detected; @, both strains not detected. Results are representative of two experiments.

