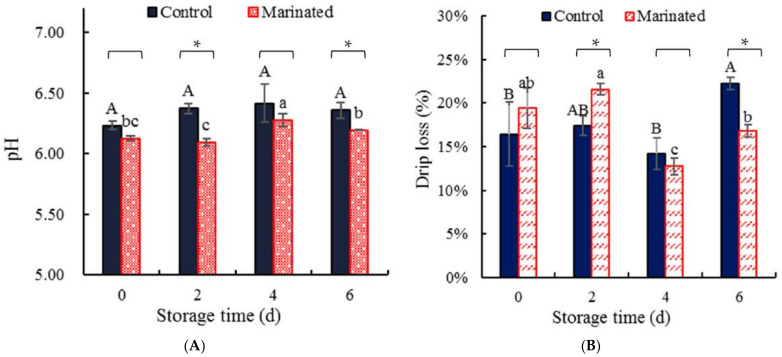
Figure 1.
The pH (A) and drip loss (B) of the marinated pork and the control. Values are presented as mean ± standard deviation. Different letters above the bars highlighting the standard deviations indicate significant differences (p < 0.05). The asterisk indicates significant differences (p < 0.05) between treatments for each time.

