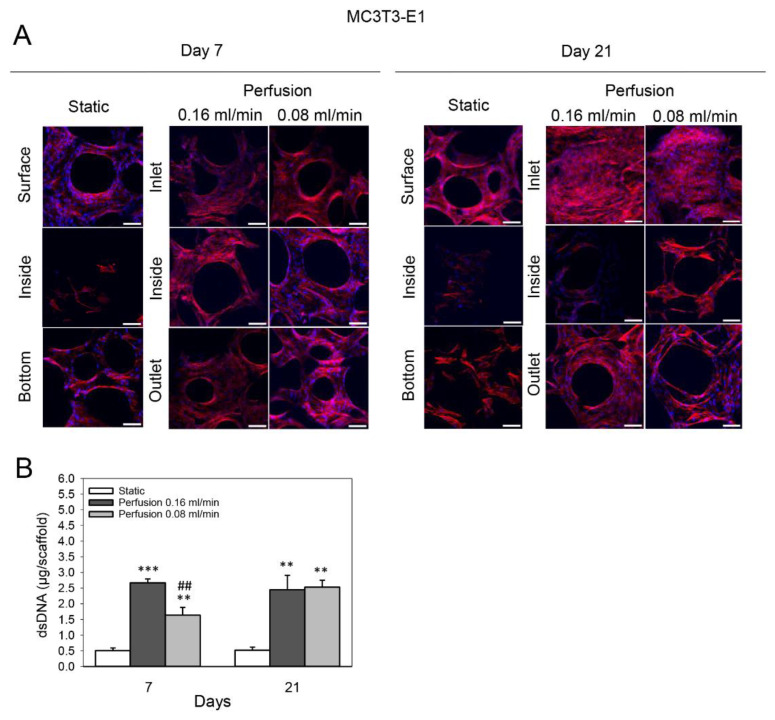
Figure 2.
Effect of medium flow and influence of flow rate on growth and distribution of MC3T3-E1 cells cultured on TiO2 scaffolds without flow (static) and with continuous flow (flow rates of 0.16 mL /min and 0.08 mL/min) for 7 and 21 days. (A) Immunofluorescence images of F-actin (red) and cell nuclei (blue). The top and bottom refer to the scaffold surfaces exposed to the medium and touching the well plate, respectively. Inlet and outlet refer to scaffold surfaces from which the flow entered and exited, respectively. Scaffolds were cut with a scalpel to observe the cellular distribution inside the scaffold. Scalebar = 100 µm. (B) Cultured scaffolds’ double-stranded DNA (dsDNA) (shown in µg/scaffold) was quantified. Values represent the mean ± SD. Significant differences were analyzed with a SigmaPlot t-test. ** p < 0.01 and *** p < 0.001 indicate significance compared to the static group; ## p < 0.01 indicates significance compared to the perfusion 0.16 mL/min group.

