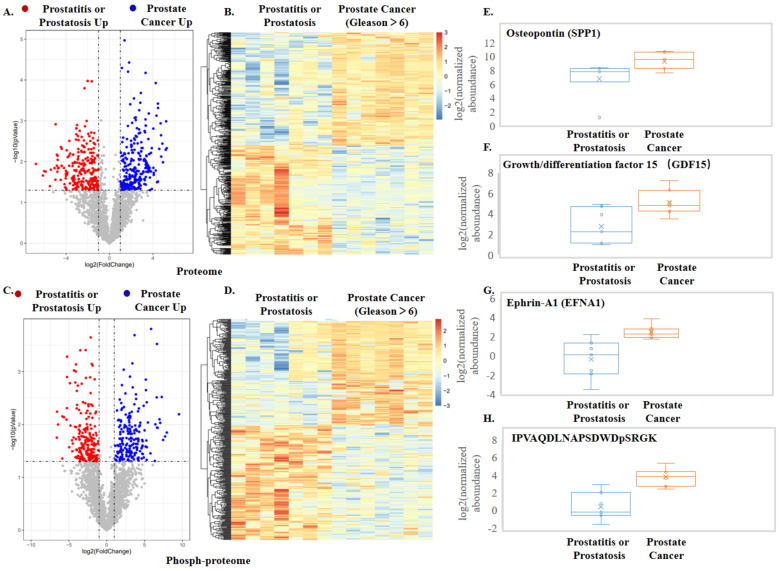
Figure 5.
Results from quantitative proteomics and phosphoproteomics analyses of urine EVs from prostate cancer patients and prostatitis or prostatosis patients. (A) Volcano plot comparison of the regulated proteins. (B,C) Volcano plot comparison of the regulated phosphopeptides. (D) Heatmap of the significantly regulated overlapped phosphopeptides in the prostate cancer and control groups. (E–G) Quantitative measurement of prostate cancer-specific protein markers. (H) Quantitative measurement of the phosphopeptide in SPP1.

