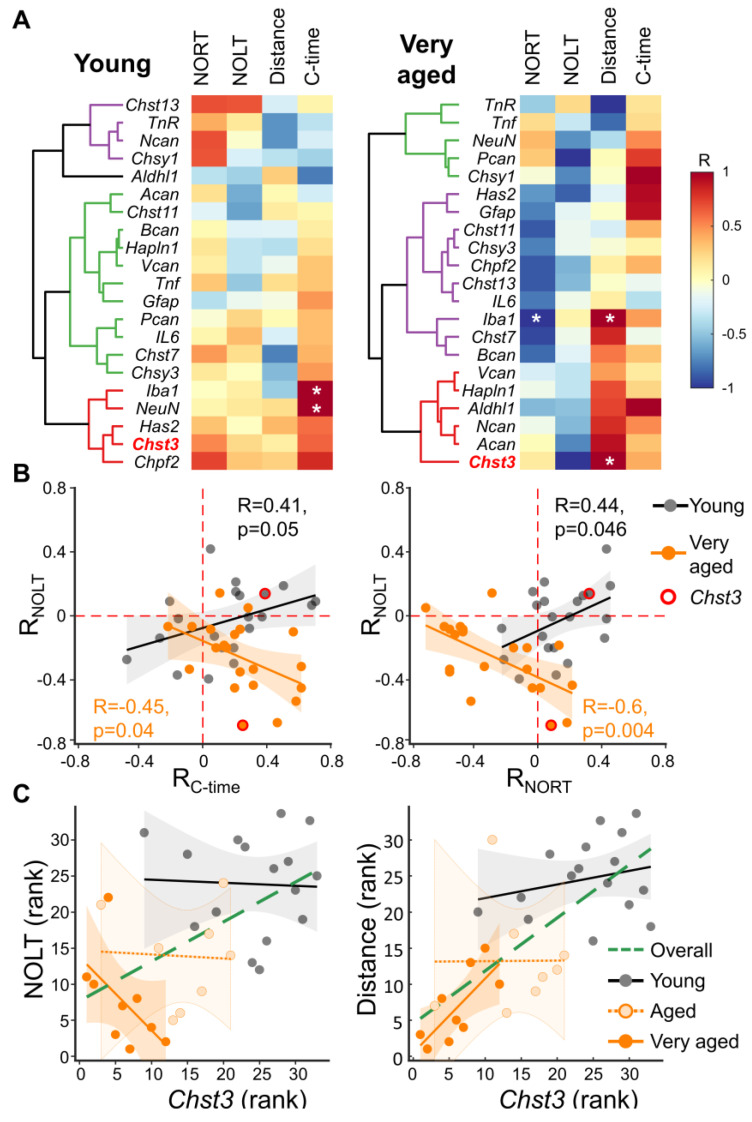
Figure 4.
Spearman’s correlation between gene expression and behavioral characteristics of mice. (A) For each young and very aged animal, the readouts for the open-field test including the distance traveled and the time spent in the central zone of the arena (C-time) together with the performance of mice in NOLT and NORT tests were correlated with gene expression for each age subgroup. (B) Different gene/behavior bi-correlation patterns in different age cohorts were estimated. Herein, each point represents one gene in the coordinates of its correlation with the corresponding behavioral parameters: the left panel- NOLT and C-time; the right panel- NOLT and NORT. The average and confidence intervals of the linear regressions for the young (gray) and very aged (orange) groups are shown as lines and shaded areas, respectively. The correlation values for Chst3 are highlighted with a red circle. (C) The correlation of Chst3 mRNA expression with behavioral characteristics was measured. The correlations between Chst3 mRNA levels and NOLT (left panel) or distance traveled (right panel) were calculated for young, old, and very aged individuals separately: grey, light, and deep orange, respectively. The overall correlation, confounded by age, is indicated by the green dashed line. Significant correlations for the left panel were: R = −0.68, p < 0.05 for very aged and R = 0.54, p < 0.001 for overall regressions. Significant correlations for the right panel were: R = 0.75, * p < 0.05 for very aged and R = 0.72, p < 0.001 for overall regressions.

