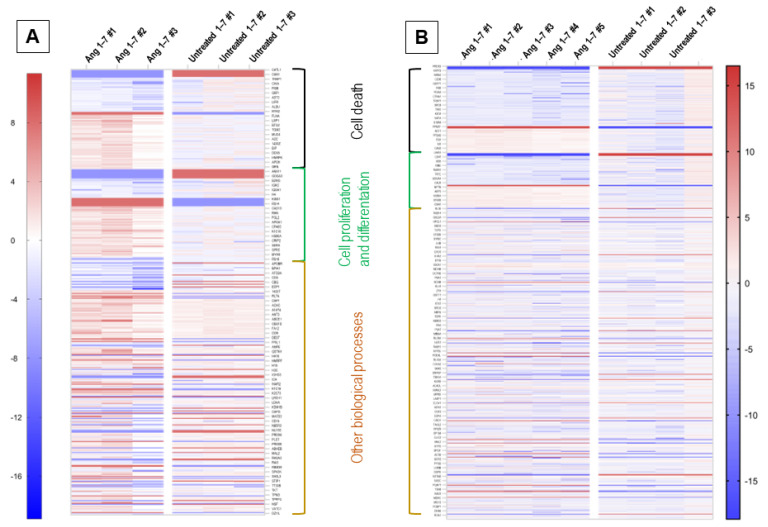
Figure 5.
Heat map representing proteome expression changes analysis of identified proteins. Colors correspond to fold change of protein expression. Regions with certain biological processes are labeled in which represented genes are involved. Panel (A): BAL fluid protein profile expression changes after Ang (1–7) stimulation in comparison to BAL fluid isolated from untreated mice. Panel (B): Proteome expression observed in whole lung tissue lysate isolated from angiotensin (1–7) and untreated mice.

