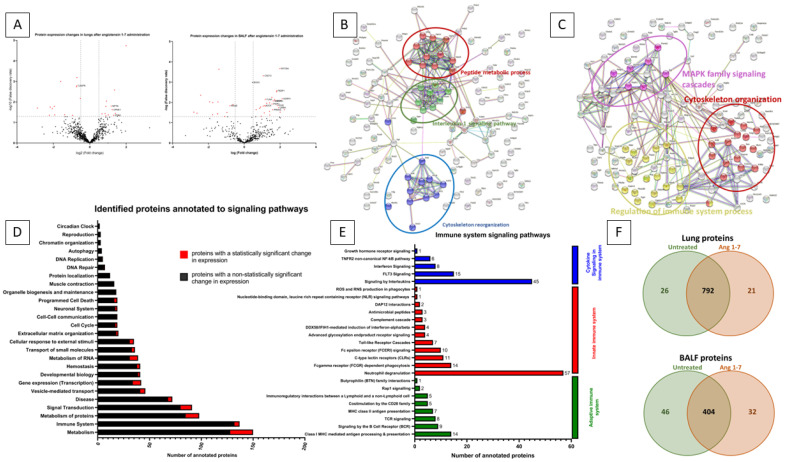
Figure 6.
Proteome analysis of whole lung tissue lysate and bronchoalveolar lavage fluid. Panel (A): Volcano plot showing protein expression fold change values and their corresponding false discovery rate (−log10 p-value). Red points show statistically significant proteins with FDA > 1.3. Volcano plot on the left represents the whole lung tissue lysate proteome after angiotensin (1–7) stimulation normalized to untreated group. Volcano plot on the right represents the bronchoalveolar lavage (BAL) fluid proteome after angiotensin (1–7) stimulation normalized to untreated group. Panel (B): Graph of mutual interactions between proteins drawn with the use of SPRING.org. Only proteins with altered expression in whole lung tissue lysate after stimulation of mice with angiotensin (1–7) were included in the analysis. The main biological processes by which the identified proteins are functionally related are marked with separate colors. With red color are labeled proteins involved in peptide metabolic process, with green color are labeled proteins involved in Interleukin-1 signaling pathway, with blue color are labeled proteins involved in cytoskeleton reorganization. Panel (C): Graph of mutual interactions between proteins drawn with the use of SPRING.org. Only proteins with altered expression identified in BALF after stimulation of mice with angiotensin (1–7) were included in the analysis. The main biological processes by which the identified proteins are functionally related are marked with separate colors. With red color are labeled proteins involved in cytoskeleton organization, with purple color are labeled proteins involved in MAPK family signaling cascades, with yellow color are labeled proteins involved in regulation of immune system processes. Panel (D): Graph represents the number of identified proteins in whole lung tissue lysate which were annotated to signaling pathways based on Reactome.org. With black color are labeled proteins which were not show altered expression after Ang (1–7) stimulation compared to untreated group. With red color are labeled protein with statistically significant change in expression after Ang (1–7) stimulation, when compared to untreated group. Panel (E): Annotation to detailed signaling pathways of immune system divided into Cytokine signaling in immune system labeled with blue color, Innate immune system labeled with red color, Adaptive immune system labeled with green color. Panel (F): Venn diagram that shows total number of identified proteins in whole lung tissue lysate (upper diagram) and BALF (lower diagram) from untreated and Ang (1–7)-treated groups.

