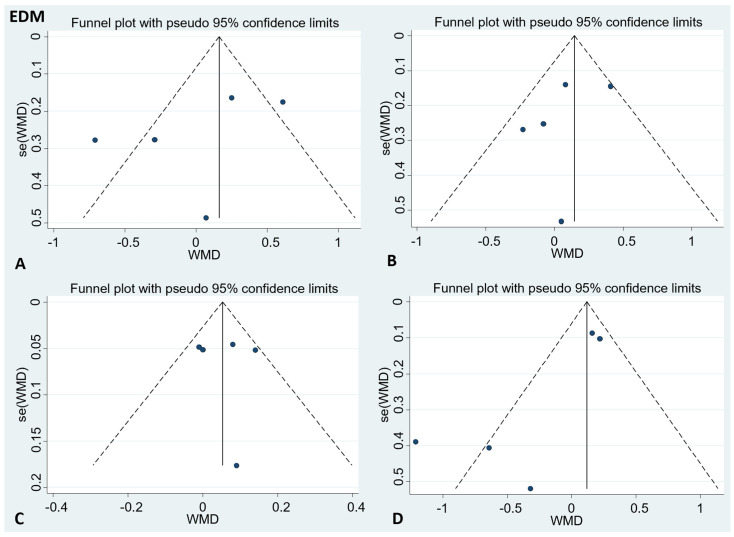
Figure 4.
Funnel plots to evaluate publication bias, and the effect of EDM for (A) TC Egger’s test (p = 0.47), (B) LDL-C Egger’s test (p = 0.56), (C) HDL-C Egger’s test (p = 0.96), and (D) TG Egger’s test (p = 0.11). A = TC; B = LDL-C; C = HDL-C; D = TG; TC = total cholesterol; LDL-C = low-density lipoprotein cholesterol; HDL-C = high-density lipoprotein cholesterol; TG = triglyceride.

