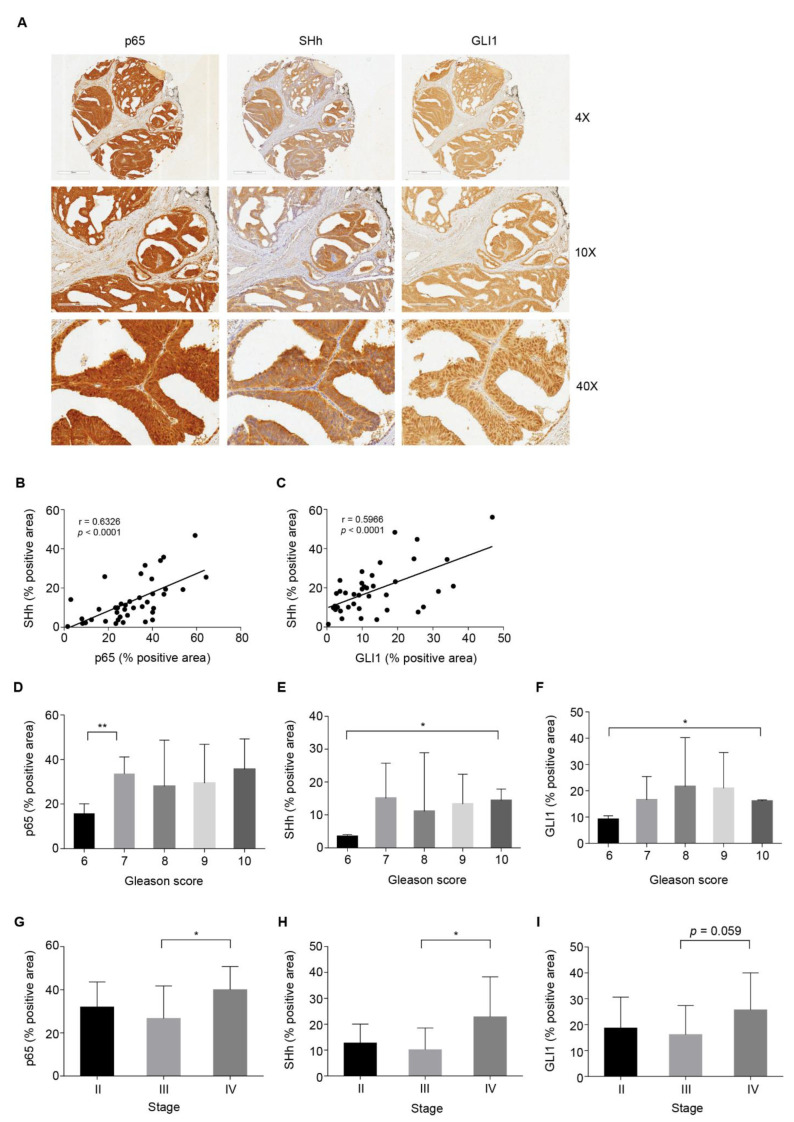
Figure 2.
NF-κB-p65 high expression correlates with SHh and GLI1 expression in PCa. (A–I) IHC analysis for p65, SHh and GLI1 on PCa tissue array (TMA). (A) Images of IHC staining of the representative tumor section core. Scale and magnifications are shown. (B,C) Correlation between the percentage of positive area for p65 and SHh (B) and SHh and GLI1 (C) in the TMA from (A). r, Pearson correlation coefficients. p < 0.0001. (D–F) IHC analysis showing the percentage of positive area for p65 (D), SHh (E) and GLI1 (F) in PCa tissue samples from (A) stratified by Gleason Score. (G–I) IHC analysis showing the percentage of positive area for p65 (G), SHh (H) and GLI1 (I) in PCa tissue samples from (A) stratified by stage of cancer. (D–I) Gleason score 6, n = 2; Gleason score 7, n = 15, Gleason score 8, n = 6; Gleason score 9, n = 15; Gleason score 10, n = 2; Stage II, n = 7; Stage III, n = 23; Stage IV, n = 10. Unpaired Student t-test or Mann–Whitney U-test were used for statistical analysis. * p < 0.05; ** p < 0.01.

