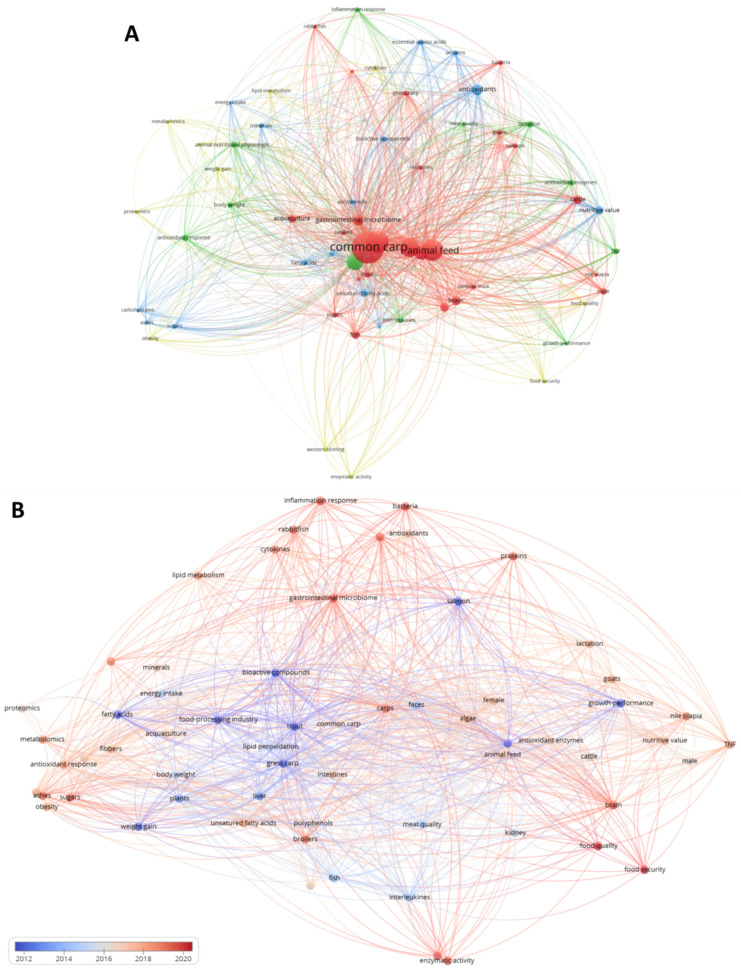
Figure 1.
Map of the co-occurrence network of the 75 selected keywords. The prominence of the circles and texts in each cluster represents the strength of their co-occurrence, while the distance of the elements and lines shows the relation and linkage among the different keywords, respectively. (A) shows the grouping of keywords into four clusters, while (B) shows the publication period, ranging from 2012 (blue) to 2022 (red).

