Figure 5.
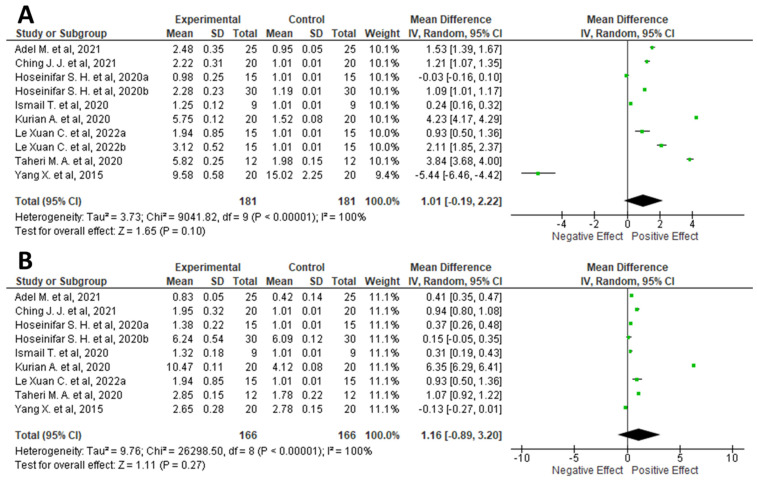
Forest diagram representation of the effects on Interleukin-1β (IL-1β) (A) and Tumor Necrosis Factor α (TNF-α) (B) resulting from supplementing fish diets with plant waste. Data were extracted from nine articles [33,34,35,36,37,38,40,42,43] and plotted against the mean difference. Each horizontal line in the graph represents an individual and specific study, with the experimental mean value displayed as a green box. For each study, if the horizontal line (95% CI) crosses the vertical line (absence of effect), no statistically significant differences can be observed between the experimental and control group. The black diamond at the bottom of the forest plot represents the average effect size calculated from the combination of the results from all selected studies. The output was generated via Review Manager (RevMan) [Computer program]. Version 5.4. The Cochrane Collaboration, 2020.

