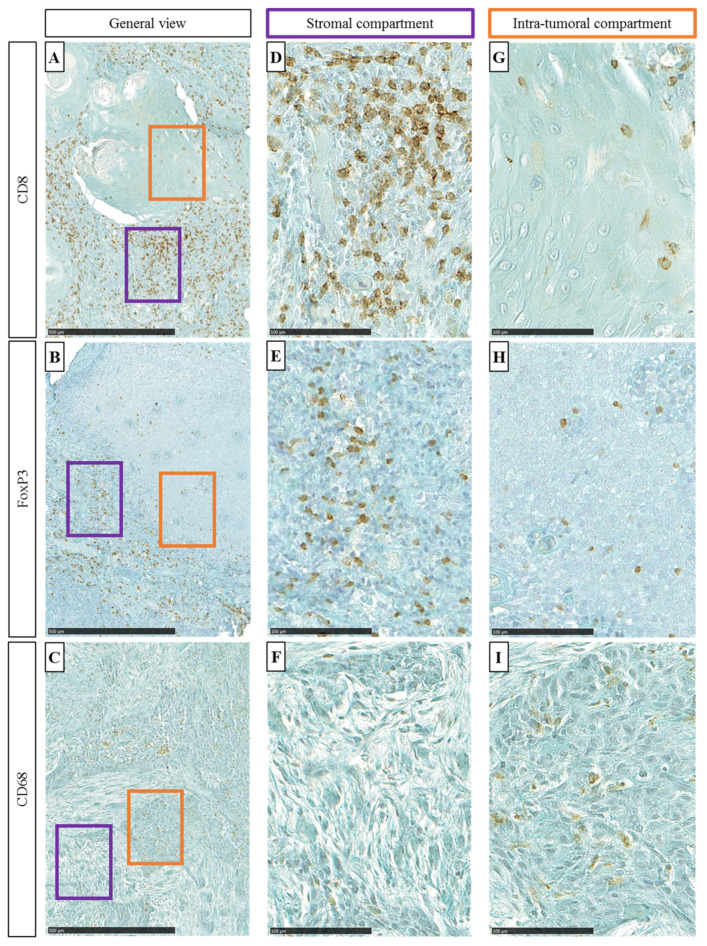
Figure 2.
((A–C), respectively) General view of CD8, FoxP3, and CD68 immunohistochemical staining (100×, scale = 500 µm). Purple oblong represents stromal (ST) area and orange oblong represents intra-tumoral (IT) area. ((D–F), respectively) Representative images of CD8, FoxP3, and CD68 immuno-marker (400×, scale = 100 µm) in the ST and ((G–I), respectively) CD8, FoxP3, and CD68 immuno-marker in the IT.

