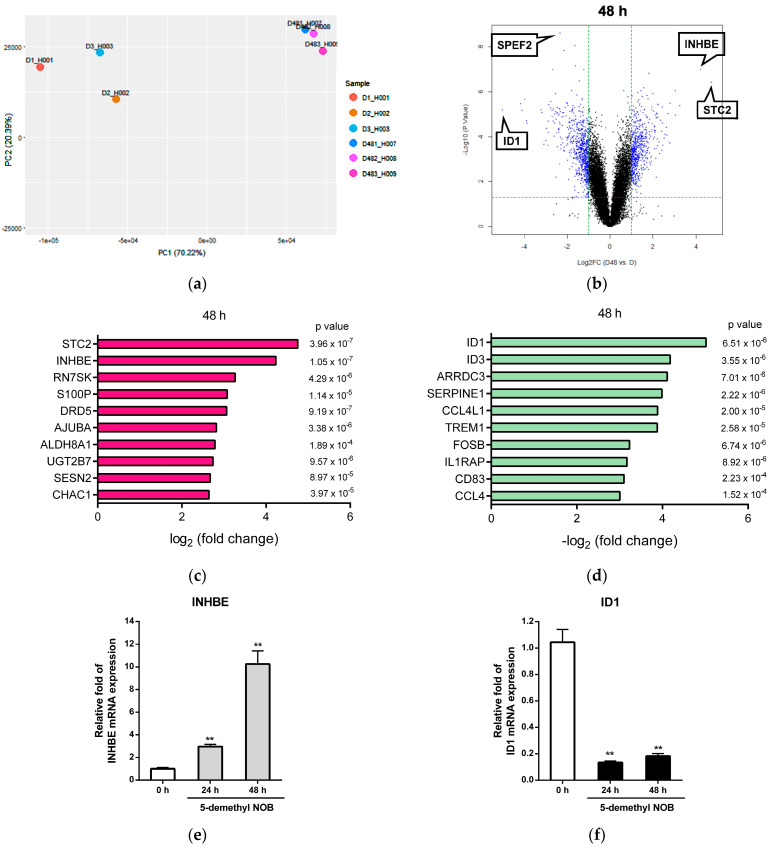
Figure 4.
Microarray analysis of 5-demethyl NOB-treated THP-1 cells. THP-1 cells were treated with vehicle or 5-demethyl NOB (40 μM) for 48 h, and the mRNA expression profiles were determined by human cDNA microarray. (a) Principal component analysis (PCA) of microarray data obtained from analyzing triplicate samples of vehicle (H001-H003) and 5-demethyl NOB (H007-H009) treatment. (b) Volcano plots of total gene expression profiles of the 5-demethyl NOB-treated cells. Each dot represents the mean expression (n = 3) of the individual gene obtained from a normalized dataset. Genes above the cutoff values (the red and green dotted lines) were considered differentially expressed genes (DEGs) (blue dots). (c) The top 10 significantly upregulated and (d) downregulated genes in response to 5-demethyl NOB treatment. RT-qPCR analysis of (e) INHBE and (f) ID1 mRNA expression in 5-demethyl NOB-treated cells for 24 and 48 h. The data represent the mean ± SD of three independent experiments. ** p < 0.01 represents significant differences compared to the 0 h group.

