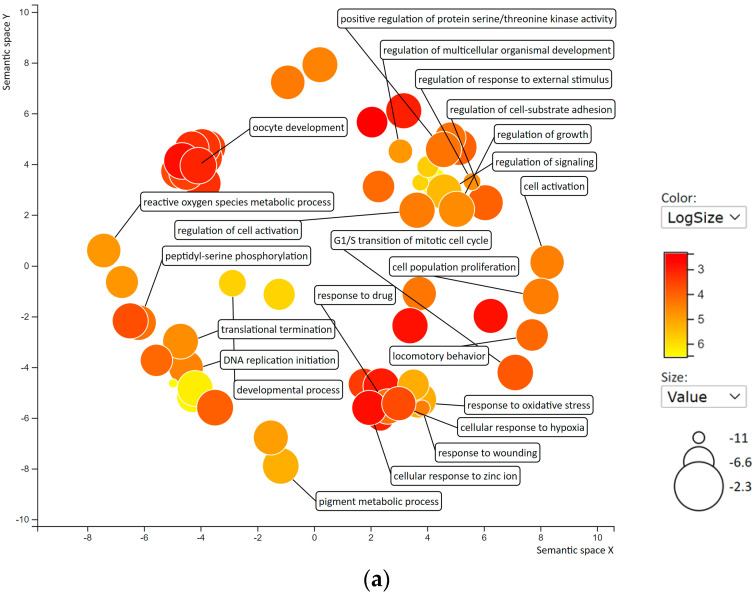
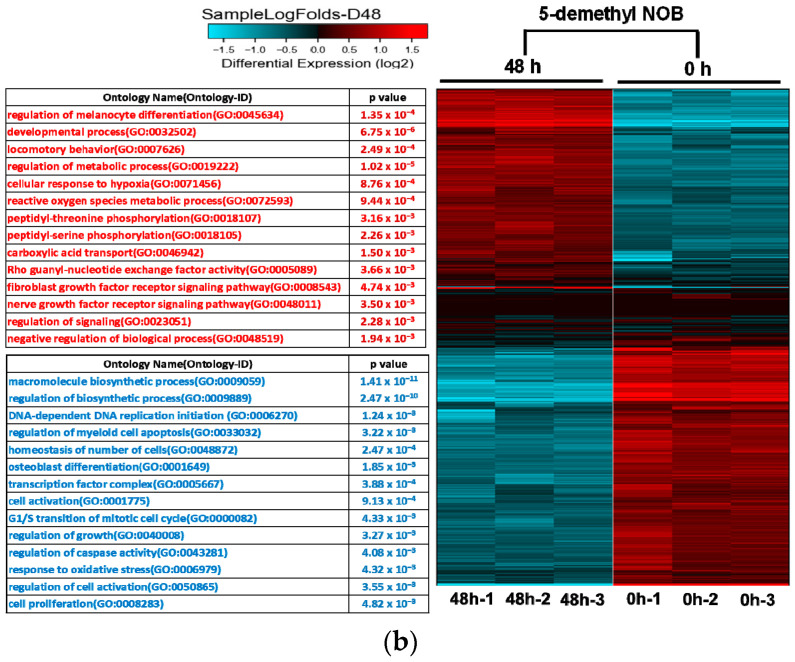
Figure 5.
Enrichment analysis and visualization of Gene Ontology (GO) results for DEGs in response to 5-demethyl NOB treatment. (a) Significantly enriched GO biological processes (BPs) in THP-1 cells treated with vehicle vs. 5-demethyl NOB (40 μM) were analyzed by REVIGO. The scatterplot represents functional clusters. The bubble color and size represent the p values and the frequency of the GO BP in the database, respectively. (b) Heatmap of enriched GO BP terms in response to 5-demethyl NOB (40 μM) treatment. GO processes listed in the upper and lower panels are terms of upregulated and downregulated DEGs, respectively. Only some of the significantly representative GO terms are shown.


