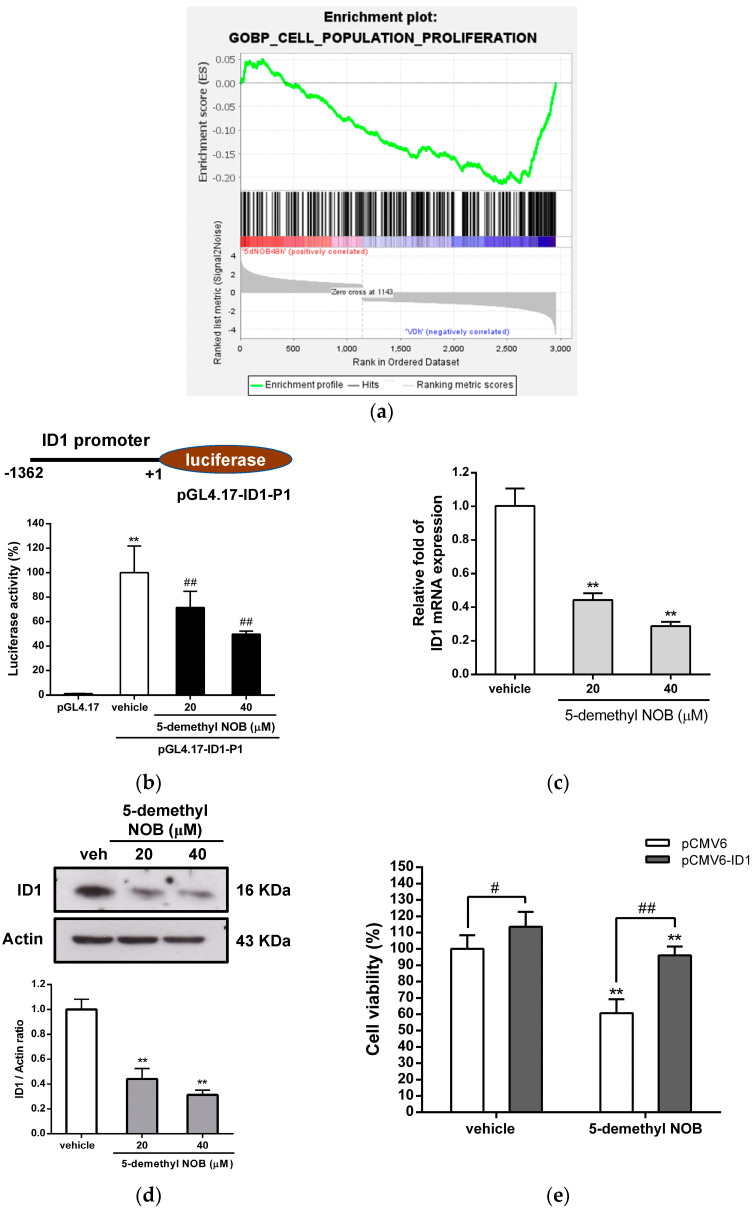
Figure 6.
Gene set enrichment analysis (GSEA) and ID1 gene expression in 5-demethyl NOB-treated THP-1 cells. (a) GSEA demonstrates that the GO BP signature “Enrichment plot: GO BP Cell Population Proliferation” (GO: 0008283) gene set is enriched with the DEGs of 5-demethyl NOB-treated cells. The barcode plot shows the position of the genes in the gene set. (b) The pGL4.17 vector or ID1 promoter-luciferase plasmid (pGL4.17-ID1-P1) and the Renilla luciferase control plasmid were co-transfected into THP-1 cells for 24 h. These cells were then treated with vehicle or 5-demethyl NOB (20 and 40 μM) for 24 h. Luciferase activity was measured and normalized to the Renilla control. The data represent the mean ± SD of three independent experiments. ** p < 0.01 represents significant differences compared to the control vector-transfected group. ## p < 0.01 represents significant differences compared to the vehicle group. (c) THP-1 cells were treated with vehicle or 5-demethyl NOB (20 and 40 μM) for 48 h, and ID1 mRNA levels were determined by RT–qPCR analysis. (d) Western blot analysis of ID1 and actin proteins. The experiments were performed in triplicate, and a representative blot is shown. The intensity of ID1 versus actin protein was normalized. The data represent the mean ± SD of three independent experiments. ** p < 0.01 represents significant differences compared to the vehicle group. (e) The pCMV6 control vector or pCMV6-ID1 expression plasmid was transfected into THP-1 cells for 24 h followed by treatment with vehicle or 5-demethyl NOB (40 μM) for 48 h. Cell viability was measured by MTT assay. The viability of the vehicle-treated group (pCMV6-transfected cells) was expressed as 100%. # p < 0.05 and ## p < 0.01 represent a significant difference compared to the 5-demethyl NOB-treated pCMV6-transfected group.

