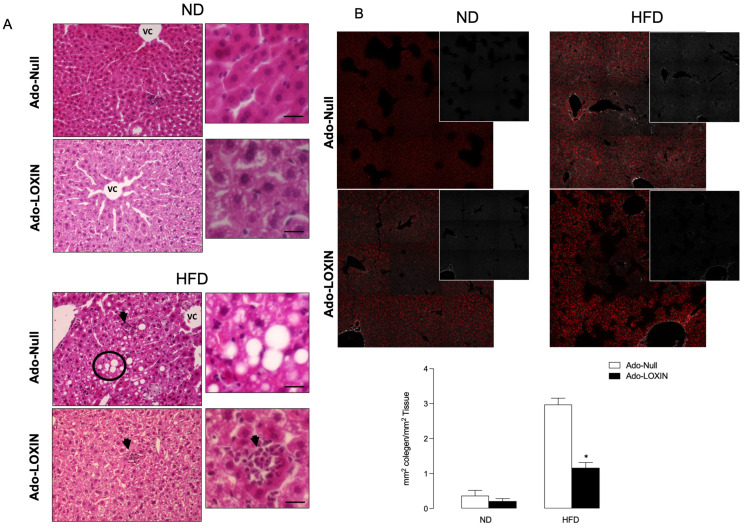
Figure 5.
Histopathological analysis of liver sections. (A) Representative pictures of mice divided into two groups, normal diet (ND) and high-fat diet (HFD) mice and infected with an adenovirus vector expressing LOXIN (Ado-LOXIN) or empty vector (Ado-Null) via the tail vein. Arrows represent inflammatory cell infiltration, and the circles indicate hepatocellular hypertrophy or damaged hepatocytes. Vc, central vein. (B) Images of collagen fibers in liver tissue were recorded with second-harmonic generation (SHG) microscopy. Collagen deposits are shown in Sirius Red staining or grey (insert). Values are expressed as mean, and SEM n = 5. Scale bars indicate 10 µm. The figure above shows the quantification of collagen fibers (n = 5). Statistical significance is represented as * p < 0.05.

