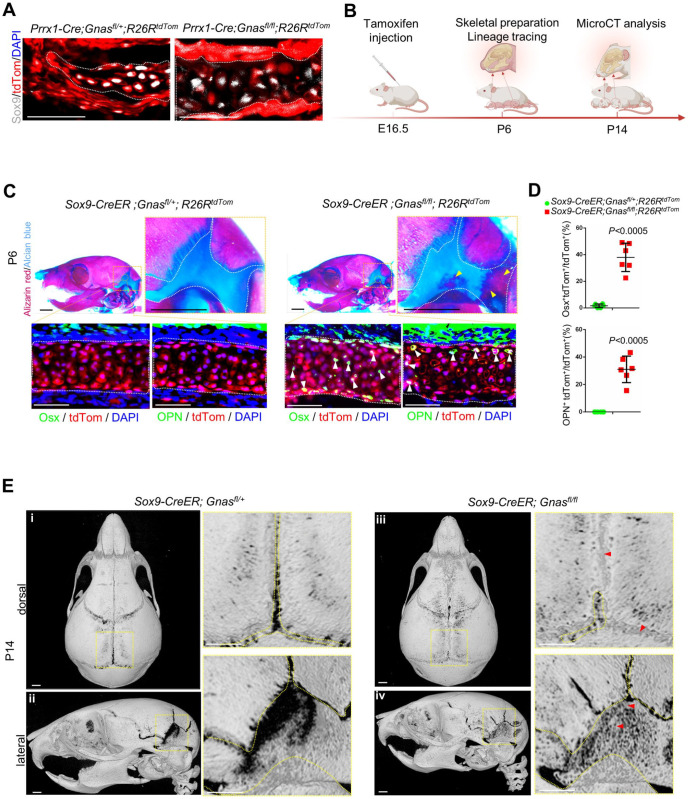
Figure 3.
Sox9+ chondrocyte-specific loss of Gnas replayed cranial cartilage heterotopic ossification (HO) and chondrocyte conversion. (A) Immunofluorescence staining of Prrx1-Cre; Gnasfl/fl; R26RTomato and controls using Sox9 antibody at P0. (B) Schematics of experiment design. (C) Skeletal preparation of mouse calvarias from Sox9-CreER; Gnasfl/fl; R26RTomato and their littermate controls (Sox9-CreER; Gnasfl/+; R26RTomato) at P6. Mastoid fontanel is outlined in white. The yellow arrow indicates HO cartilage. Scale bar: 1 mm. Immunostaining using antibody of Osterix (Osx) and osteopontin (OPN) on serial sections. Outlined mutant cranial cartilage (tdTom) in an osteogenic differentiated status (Osx or OPN, green) indicated by arrows. Scale bar: 50 μm. (D) Quantification of suture cartilage in Sox9-CreER; Gnasfl/fl; R26RTomato. Percentage of Osx+tdTom+ double positive cells and percentage of OPN+tdTom+ double positive cells, respectively, among total tdTom+ chondrocytes at P6. N = 6, fields from 4 mice. Mean ± SD. Two-tailed t test. (E) Micro–computed tomography 3-dimensional reconstruction of Sox9-CreER; Gnasfl/fl and their control littermates at P14. Dotted lines (yellow) outline patent sutures and fontanels; the arrow (red) indicates HO. Scale bar: 1 mm.

