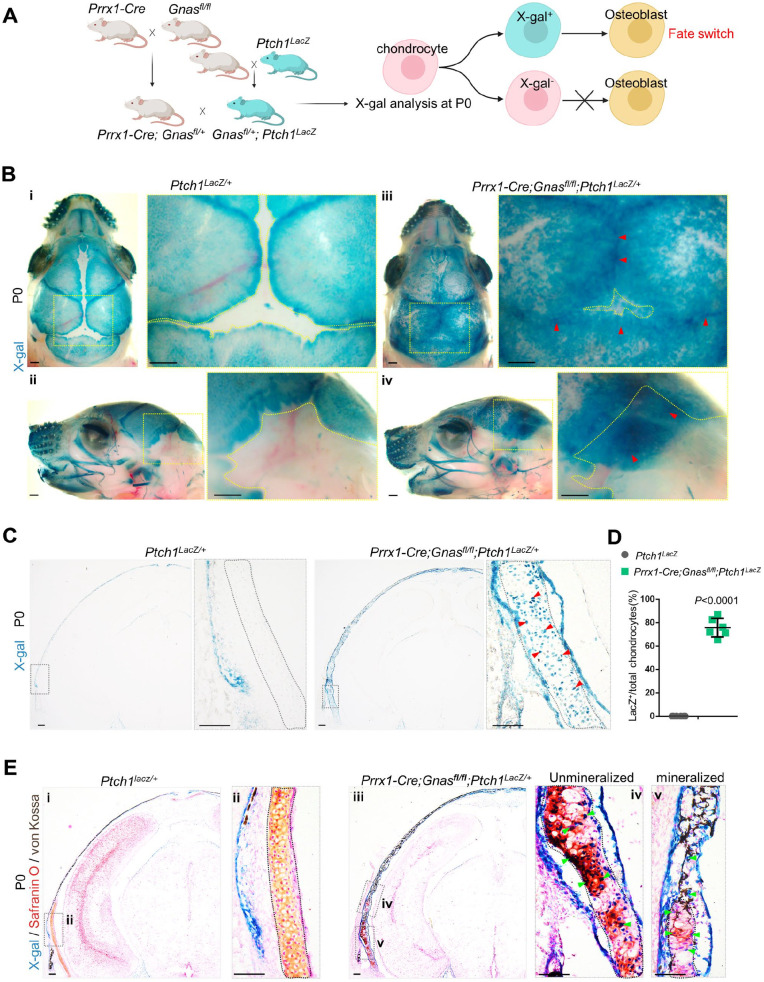
Figure 4.
Loss of Gnas transformed chondrocytes by activating Hedgehog (Hh). (A) Schematics of mice mating. (B) Whole-mount X-gal staining of Prrx1-Cre; Gnasfl/fl; Ptch1LacZ mouse and control littermate calvarias. The arrow (red) indicates ectopic X-gal (green) in outlined sutures and fontanels. Scale bar: 0.5 mm. (C) X-gal staining on coronal cryostat sections of Prrx1-Cre; Gnasfl/fl; Ptch1LacZ mouse calvaria. The arrow (red) indicates X-gal+ chondrocytes (green) in the outlined cartilage. Scale bar: 100 μm. (D) Quantification of X-gal staining. Percentage of X-gal+ chondrocytes among total chondrocytes. N = 6 mice. Mean ± SD. Two-tailed t test. (E) Costaining with Safranin O and von Kossa on X-gal staining of Prrx1-Cre; Gnasfl/fl; Ptch1LacZ mouse and control littermate calvarias. The arrow (green) indicates X-gal+ chondrocytes contributing to the mineralization of mutant cartilage (outlined). Scale bar: 100 μm.

