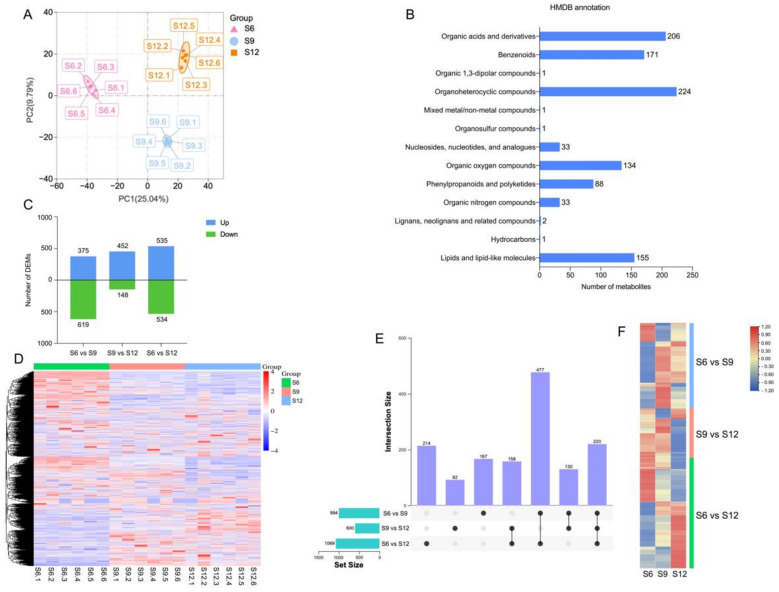
Figure 2.
Metabolome analysis of sweet cherries during development. (A) PCA analysis of metabolites at each developmental stage; (B) HMDB classification annotation of metabolites; (C) the number of DEMs compared at any two different developmental stages; the number of upregulated and downregulated metabolites is represented by the bars above and below the x-axis, respectively; (D) heatmap of all DEMs at three developmental stages, with colors indicating the relative level content of each DEM, from low (purple) to high (red); (E) upset plots of ubiquitously and exclusively expressed DEMs in pairwise comparisons across developmental stages; (F) heatmap of expression patterns of unique DEMs in the three comparison groups, with different colors representing the relative level content of each DEM, from low (blue) to high (red).

