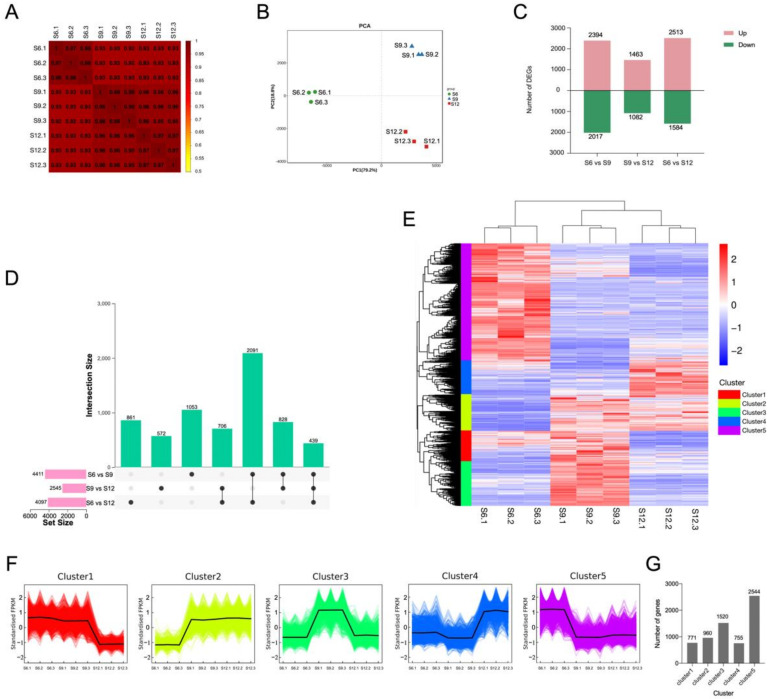
Figure 3.
Transcriptome analysis of sweet cherries during development. (A) Spearman correlation coefficients of gene expression at different developmental stages; (B) PCA analysis of gene expression at each developmental stage; (C) the number of DEGs compared at any two different developmental stages; the number of upregulated and downregulated genes are represented by the bars above and below the x-axis, respectively; (D) upset plots of ubiquitously and exclusively expressed DEGs in pairwise comparisons across developmental stages; (E) hierarchical clustering of DEGs for all samples; (F) K-means clustering of DEGs expression trends, the expression profiles of genes in each cluster are represented in different colors, and the average expression profiles of all genes in each sample are represented in black; (G) summary of K-means clustering results, the specific number of DEGs contained in each cluster.

