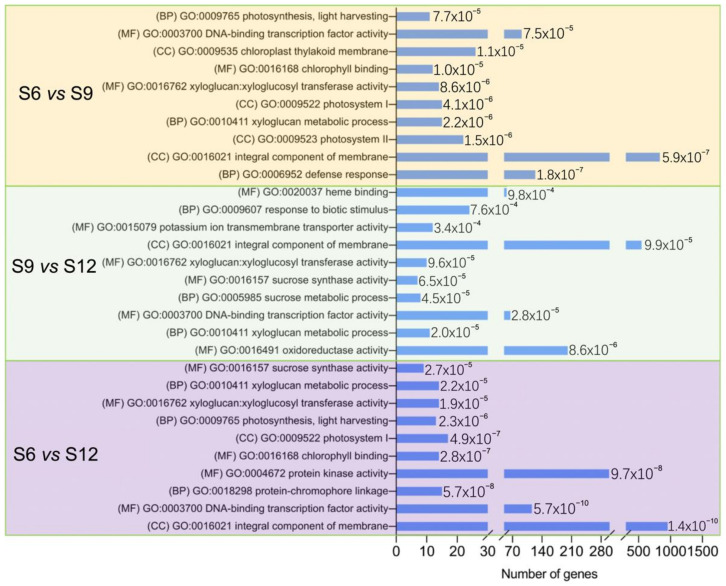
Figure 4.
GO enrichment analysis of DEGs between groups was compared. The figure shows the top 10 rich items with extremely significant (≤0.05) p-values for each comparison, and the values of the p-values are shown in the bar chart. (BP): biological process; (MF): molecular function; (CC): cellular component.

