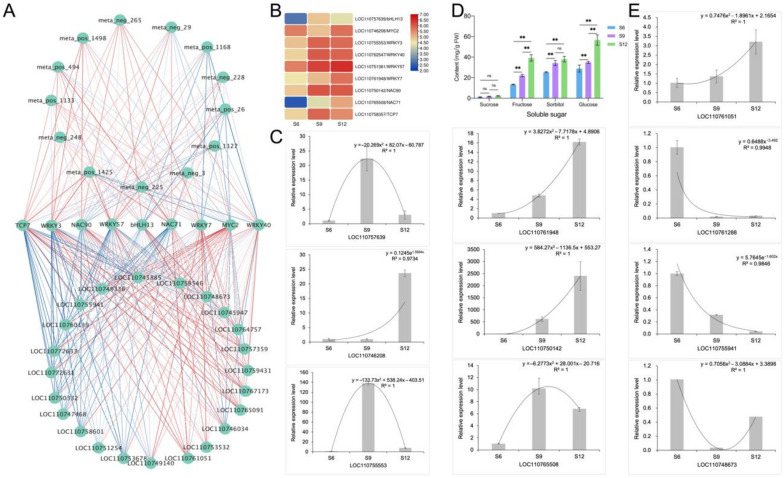
Figure 9.
Identification and validation of glucose metabolism-related networks. (A) Correlation network identification of 9 transcription factors with DEMs and DEGs related to sugar anabolism. Correlations are represented by blue and red lines from low to high. (B) Expression patterns of 9 transcription factors, transformed according to log2 to FPKM values of transcription factors, with colors indicating the relative content of each transcription factor, from low (blue) to high (red). (C) qRT-PCR analysis of 6 transcription factors. (D) Composition and content of soluble sugars in different developmental stages of sweet cherries. ns means not significant, ** means extremely significant correlation at the 0.01 level; (E) qRT-PCR analysis of four sugar anabolic genes.

