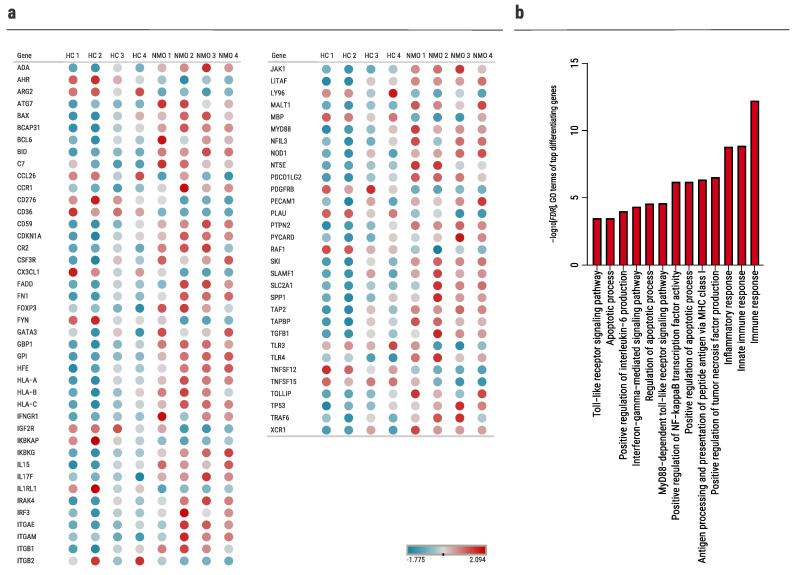
Figure 1.
Immunological gene expression profiling in human primary astrocytes cultured with NMO sera. NanoString nCounter analysis of astrocytes cultured with human sera from HCs (n = 4) and NMO (n = 4) patients. (a) Dot plot illustrating top 73 differentially expressed genes: blue denotes low expression, red denotes high expression (padj < 0.1), (b) analysis of top 73 differentially expressed genes in NMO cultured astrocytes versus HC cultured astrocytes. Plot of the top enriched gene ontology (GO) terms (focus on ‘function’ in GOrilla), sorted by –log10[FDR].

