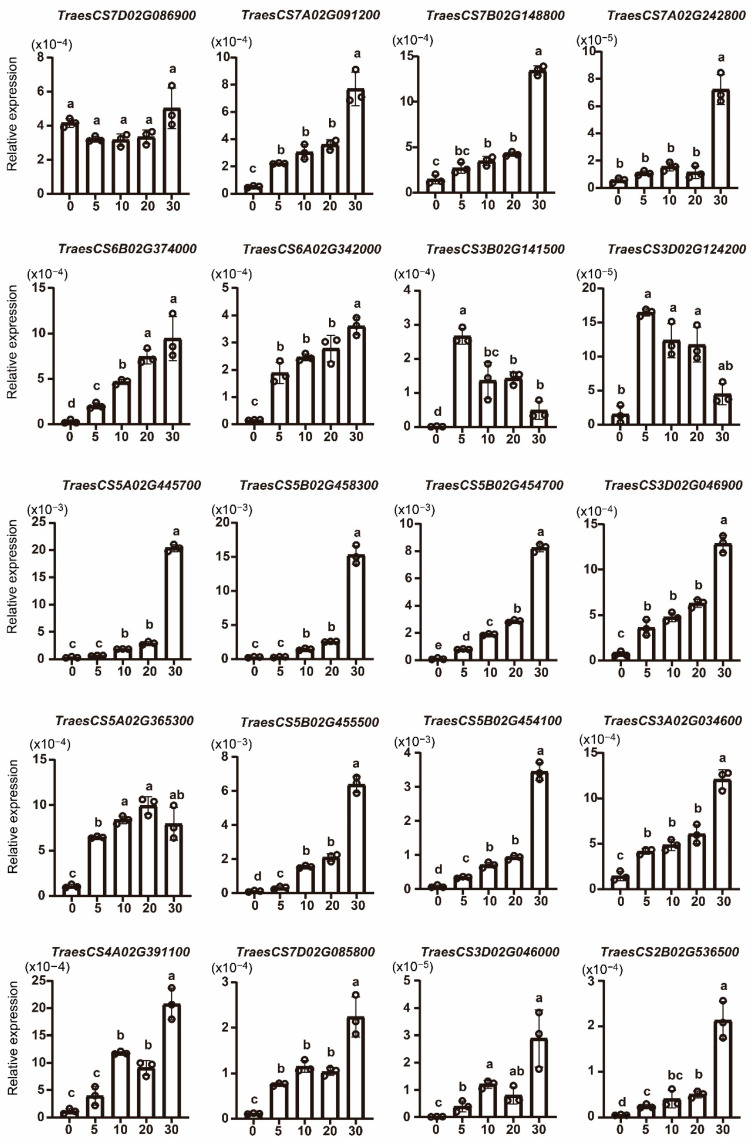
Figure 8.
Expression analysis of TaWAK genes in wheat after treatment with exogenous pectin for 0, 5, 10, 20, and 30 min. The wheat tubulin gene was used as the internal control. The Student’s t-test was performed to compare the significant differences. Error bars show the standard deviation. Data are mean ± SD (n = 3).

