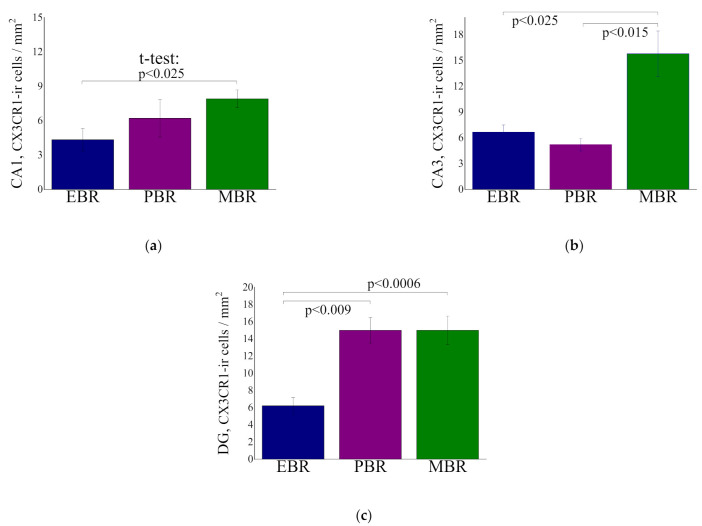
Figure 7.
Quantitative analysis of CX3CR1-ir cells in the CA1 (a), CA3 (b) and DG (c) hippocampal subregions at day 8 post PSS-exposure in animals with an extreme behavioral response (EBR) or partial response (PBR) to the PSS exposure, and in animals whose behavior was minimally affected by the stressor (MBR). All data represent the group means ± S.E.M.

