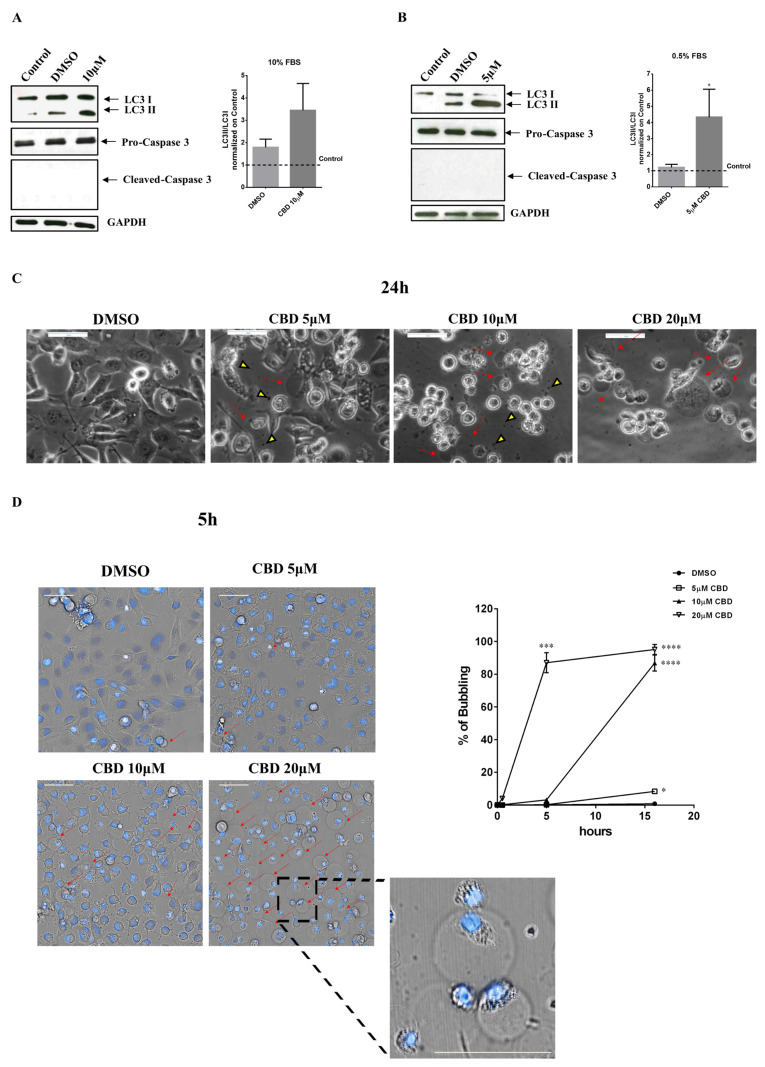
Figure 4.
CBD induces autophagy and bubbling cell death in low serum conditions. MDA-MB-231 cells were seeded, and the day after, the medium was replaced either: (A) with DMEM 10% FBS, containing or not 10 µM CBD; or (B) with DMEM 0.5% FBS, containing or not 5 µM CBD (DMSO is referred to as control). Cell lysates were separated on SDS-PAGE and blotted to nitrocellulose membrane; blots were probed with anti-LC3, anti-caspase3 or anti-GAPDH antibodies. GAPDH was used as a loading control. Data are expressed as mean ± S.E.M. from three independent experiments. Differences among groups were analyzed using the Wilcoxon test. * p < 0.05. (C) MDA-MB-231 cells were seeded and treated as described in Materials and Methods. 24 h after the treatment, optical images were captured. Scale bar: 50 µm. Red arrows indicate gas bubbles while yellow triangles indicate exosomes. (D) MDA-MB-231 cells were seeded in uClear black 96-well plates. After 24 h, cells were stained with Hoechst (blue), treated with the indicated concentrations of CBD in DMEM 0.5% FBS, and time-lapse imaging was performed using Operetta CLS™ equipped with a 40× immersion objective. On the left, cellular morphology of MDA-MB-231 after 5 hours from the treatment. Scale bar: 50 µm. Red arrows indicate gas bubbles. A magnified view of gas bubbles is shown. On the right, the percentage of cells positive for gas bubbles at different time points is shown. Data are expressed as mean ± S.E.M. from three independent experiments. Differences among groups were analyzed using a one-way analysis of variance (ANOVA) followed by Dunnett’s post hoc test. * p < 0.05, *** p < 0.001, **** p < 0.0001.

