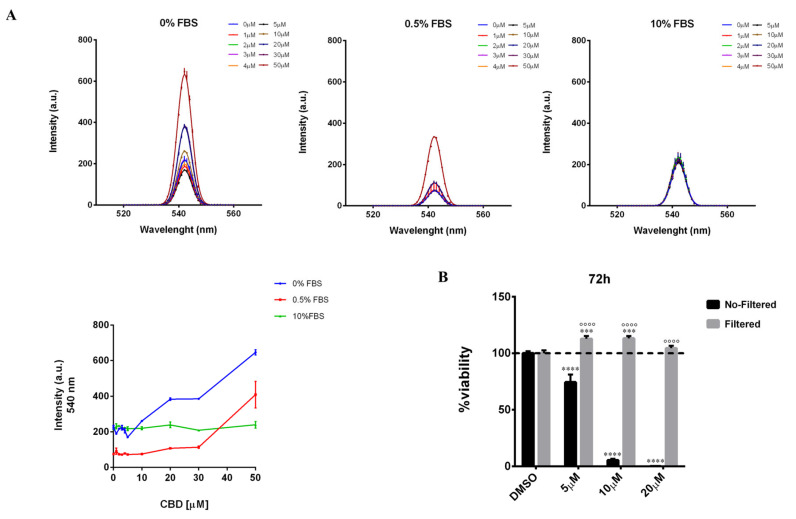
Figure 5.
Serum exerts a surfactant action on CBD-aggregates. (A) Light scattering spectra of increasing concentrations of CBD in DMEM medium (without phenol red) supplemented with different concentrations of serum (0% FBS, 0.5% FBS, 10% FBS). On the bottom left, a graphical representation of the light scattering of the samples at 540 nm. (B) MDA-MB-231 cells were plated on 96-well plates. The day after, cells were treated as described in Materials and Methods. Cell viability was quantified after 72 h of the treatment. No-Filtered = CBD was added in DMEM medium without phenol red (containing 0.5% FBS) and then cells were treated with this solution. Filtered = CBD was added in DMEM medium without phenol red (containing 0.5% FBS); after that, the solution was incubated at 37 °C for 20 min, then it was filtered and added to cells. Data are expressed as mean ± S.E.M. from three independent experiments. Differences among groups were analyzed using two-way ANOVA followed by Sidak’s test for group comparison and multiple t-tests. *** p < 0.001, **** p < 0.0001 indicated significance compared to DMSO. ∘∘∘∘ p < 0.0001 indicated significance compared to the No-Filtered sample at the same concentration.

