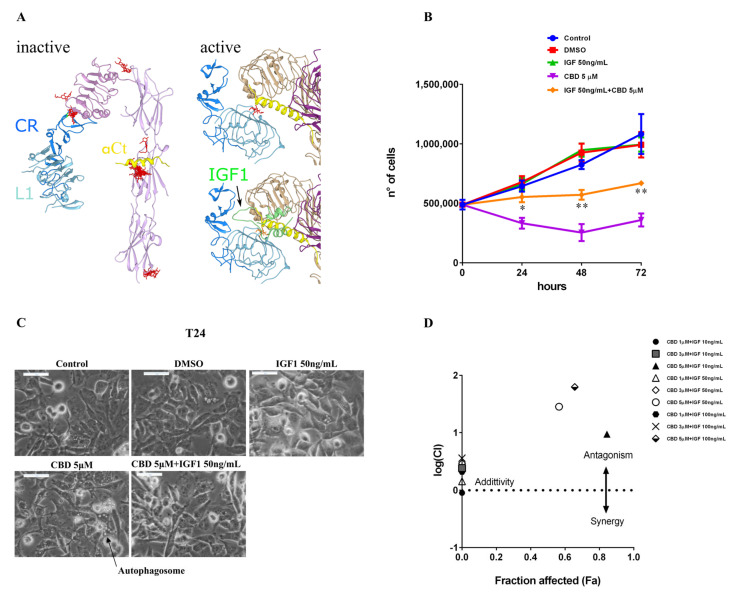
Figure 7.
Docking experiments suggest that CBD can bind to overlapping sites with IGF-1. (A) Domains involved in the intermolecular interaction upon receptor activation are differently colored for identification: L1 domain is light blue, CR connector is blue, αCt helix is yellow. CBD molecules are represented as red sticks. Left, the best poses of the top 20 clusters were reported for the Swissdock docking survey with CBD as a ligand and an inactive IGF-1R structure (PDB ID: 5u8r, minus the antibody chains) as a receptor. Top right, best pose from the flexible docking experiment on an active structure of IGF-1R (PDB ID: 6pyh, minus the natural ligand, IGF-1). The two different monomers are colored in purple (the αCt belongs to this monomer) and tan (the visible L1 and CR belong to this monomer). Bottom right, the IGF-1 (green) position in the active receptor structure (6pyh) is shown, overlapping the CBD docking site. (B) MDA-MB-231 cells were plated on 24-well plates. After 24 h, cells were treated with CBD (5 µM) alone or in combination with IGF-1 in a DMEM medium supplemented with 0.5% FBS. The number of viable cells was determined via Trypan blue staining at 0, 24, 48, and 72 h. Data are expressed as mean ± S.E.M. from three independent experiments. Differences among groups were analyzed using multiple t-tests. * p < 0.05, ** p < 0.01 indicates significance between IGF-1 50 ng/mL + CBD 5 µM and CBD 5 µM. (C) Cellular morphology of MDA-MB-231 cells treated as described above and after 24 h optical images were captured. Scale bar: 50 µm. (D) MDA-MB-231 cells were seeded in 96-well plates. The day after, cells were treated with different concentrations of CBD (1, 3, 5 µM) and IGF-1 (10 ng/mL, 50 ng/mL, 100 ng/mL), alone or in combination. Then 72 h later, cell viability was tested using MTT assay as described in Materials and Methods. Cell viability data were converted to Fraction affected (Fa) values and analyzed by CompuSyn software to obtain a combination index plot. log(CI) < 0, synergism; log(CI) = 0, addictive effect; log(CI) > 0, antagonism. Black hexagon (CBD 1 µM + IGF 100 ng/mL) is partially covered by gray box (CBD 3 µM + IGF 10 ng/mL).

