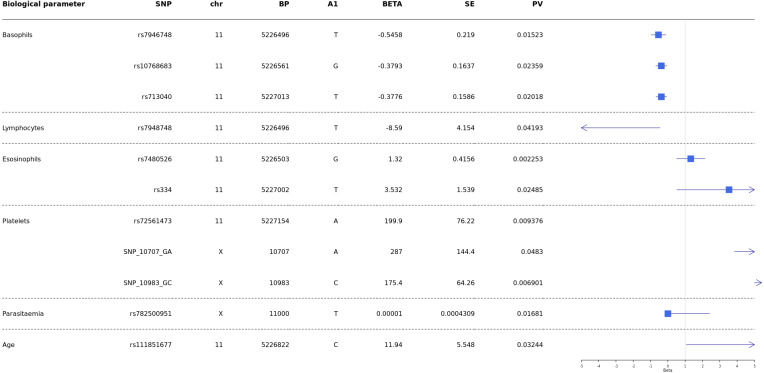
Figure 4. Forest plot of associations between HBB and G6PD polymorphisms and biological and cellular parameters.
Multivariate linear regression analysis with biological parameters. The blue squares represent βeta values. The horizontal lines around squares represent the 95% Confidence Intervals. SNP, single nucleotide polymorphism; MAF, minor allele frequency; beta, regression coefficient corresponding to the minor allele of each SNP; SE, Standard Error; BP, genomic location; PV, p-value; CHR, chromosome code; A1, Allele 1 (usually minor).

