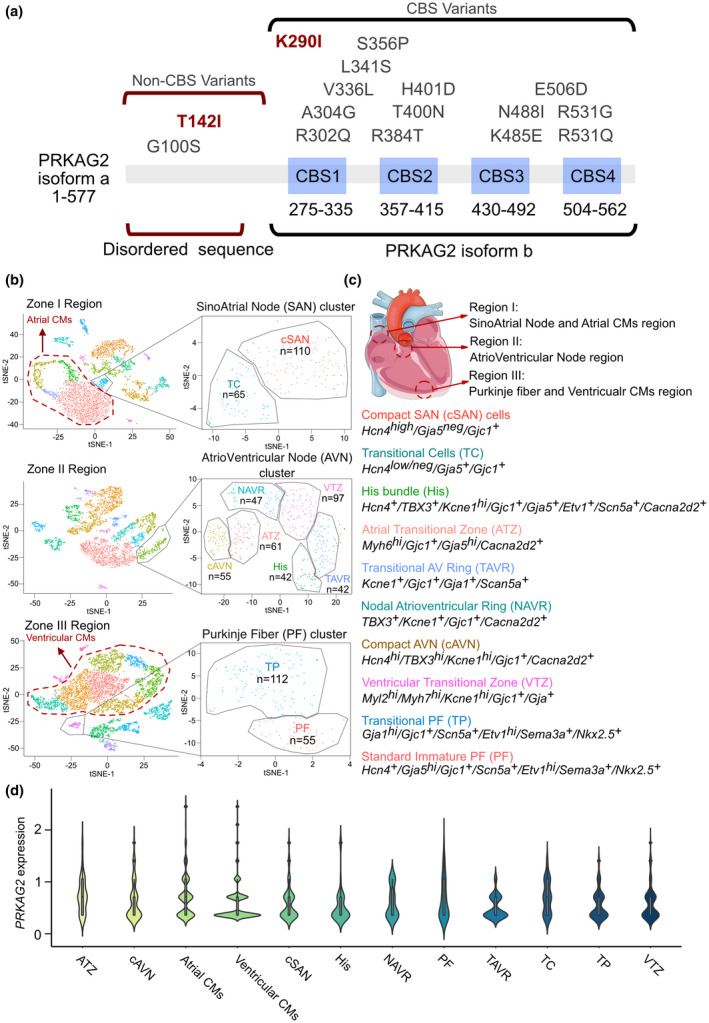
FIGURE 3.

Using single‐cell RNA‐seq data (GSE132658), PRKAG2 was identified as being expressed both in CMs and conduction system cells. (a) Summary of current reports on individuals with PRKAG2 variants. (b) Cluster cell numbers and t‐distributed stochastic neighbor embedding (tSNE) plot for zone I, II, and III cells. (c) The isolated markers of conduction system‐related cells and the location of zone I, II, and III cells in the heart. (d) ViolinPlots of PRKAG2 expression in specific cell types in the heart
